Battery Chart
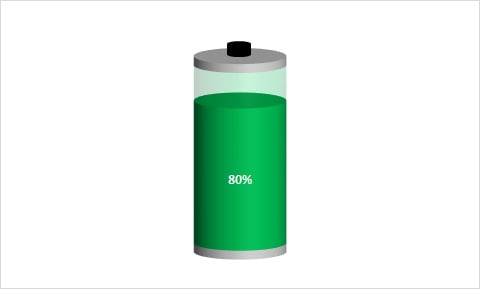
Battery chart is used to show the KPI metrics performance. This is useful and beautiful visual.
Speedometer Chart
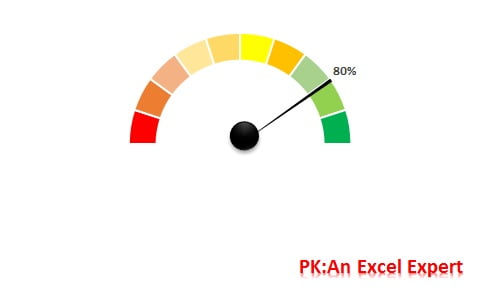
Speedometer Chart is very useful Visual to display KPI metrics. We can showcase metric like Service Level.
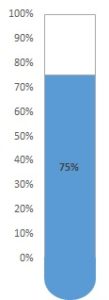
Test Tube Chart
Test tube Chart is also a useful chart to display KPI metrics. We can showcase metric like Service Level.
Progress Circle Chart
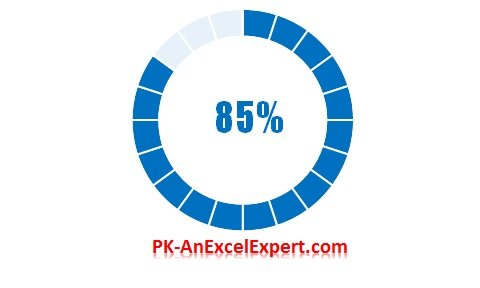
Progress Circle Chart is beautiful visual to display a KPI metric performance like Service level.
Moving Man Chart
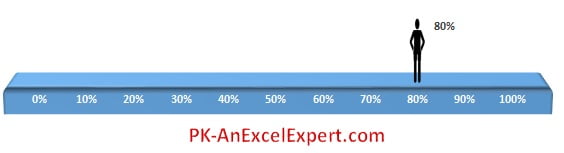
An Innovative chart to display the a KPI metric performance like Service level. This is the combination of Chart and Shapes.
Dynamic Chart with check boxes
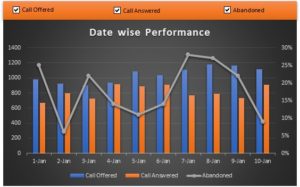
This the useful chart show/hide the metrics by using the check boxes. No VBA has been used.