Managing clinic projects is never simple. Clinics constantly run infrastructure upgrades, IT implementations, medical equipment installations, compliance initiatives, and process improvement projects. However, when project data stays scattered across Excel sheets, emails, and static reports, teams lose visibility. As a result, delays increase, budgets overrun, and risks remain hidden.
That is exactly why a Clinic Project Management Dashboard in Power BI becomes a powerful and practical solution.
In this in-depth article, you will learn what a Clinic Project Management Dashboard in Power BI is, why clinics need it, how it works, its complete page-wise structure, key KPIs, advantages, best practices, and frequently asked questions. Moreover, this guide uses clear language, strong transitions, and real clinic project logic so you can confidently apply it in real-world healthcare environments.
Click to Purchases Clinic Project Management Dashboard in Power BI
What Is a Clinic Project Management Dashboard in Power BI?
A Clinic Project Management Dashboard in Power BI is a centralized, interactive analytics tool designed to track, analyze, and visualize clinic project performance in one place.
Instead of manually reviewing raw project data, this dashboard converts complex information into actionable insights. Consequently, clinic administrators, project managers, finance teams, and leadership gain instant clarity on budgets, timelines, risks, and progress.
More importantly, Power BI allows real-time filtering, drill-downs, and dynamic visuals. Therefore, teams move from reactive firefighting to proactive project control.
Why Do Clinics Need a Project Management Dashboard in Power BI?
Clinics operate in a highly regulated, cost-sensitive, and patient-focused environment. Therefore, project delays or budget overruns directly impact patient care and operational efficiency.
Here is why clinics increasingly adopt Power BI project dashboards:
-
Projects involve multiple departments, vendors, and stakeholders
-
Budgets remain tight and highly scrutinized
-
Compliance and risk management require constant monitoring
-
Leadership demands real-time visibility, not monthly static reports
Because of these challenges, a Power BI dashboard brings structure, transparency, and accountability into clinic project management.
How Does a Clinic Project Management Dashboard in Power BI Work?
The dashboard connects to structured project data, usually stored in Excel, SharePoint, databases, or cloud systems. Then, Power BI transforms this data into interactive visuals.
Here is how it works step by step:
-
Data Collection – Project budgets, costs, timelines, risk levels, and statuses
-
Data Modeling – Relationships between clinics, departments, managers, and project types
-
KPI Calculation – Budget variance, delay percentage, completion rate, and risk indicators
-
Visualization – Cards, charts, trends, and slicers
-
Decision-Making – Teams analyze, filter, and act in real time
As a result, clinics gain full control over project execution without manual effort.
What Are the Key Pages in a Clinic Project Management Dashboard in Power BI?
This dashboard includes five professionally structured pages, each designed to answer specific business questions. Let us explore each page in detail.
1. What Does the Overview Page Show in a Clinic Project Management Dashboard?
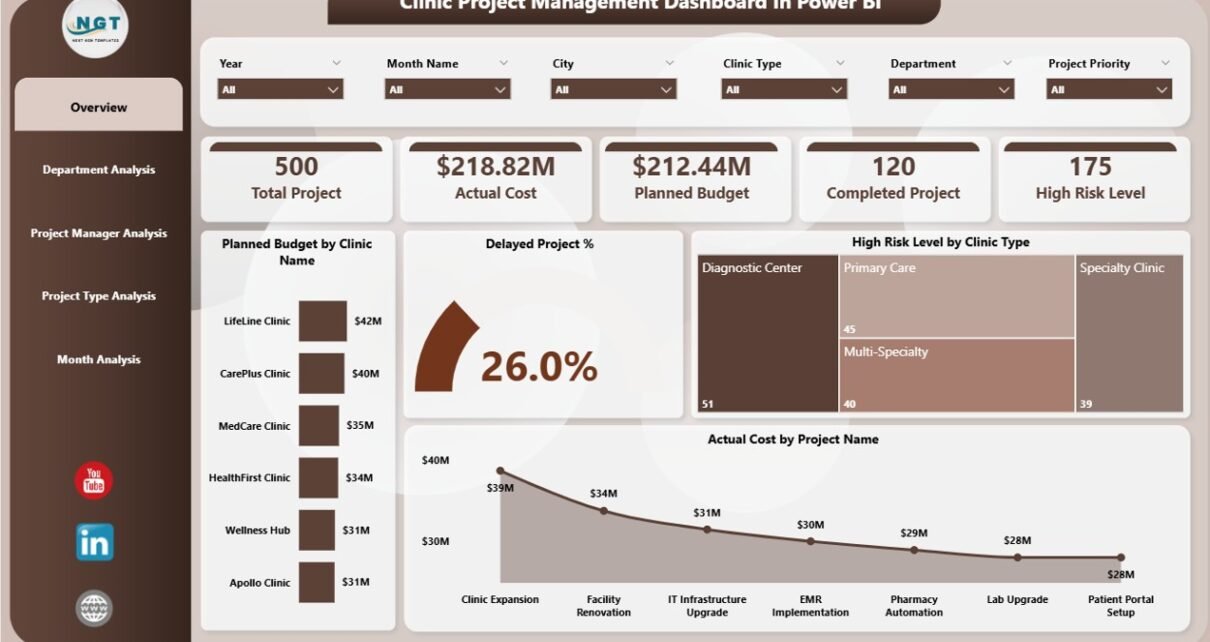
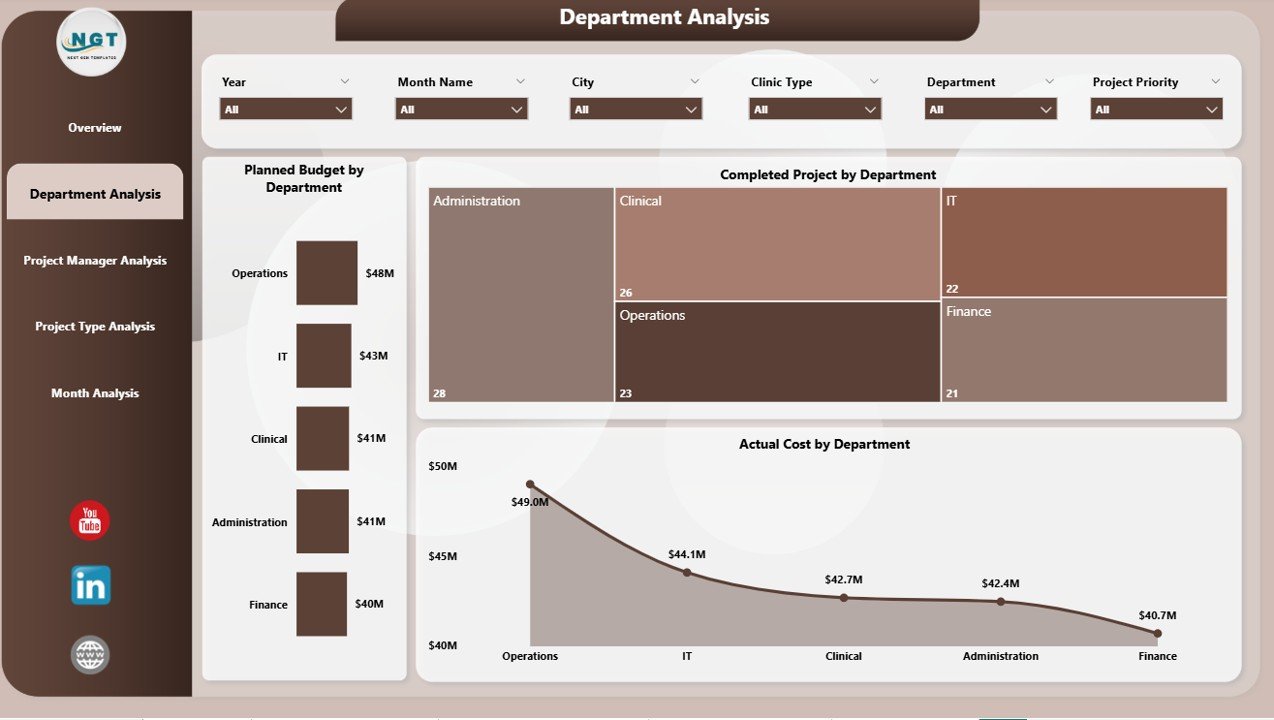
The Overview Page acts as the command center of the dashboard. It provides a high-level snapshot of all clinic projects.
Key Elements of the Overview Page
Interactive Slicers
-
Filter by clinic name, department, project type, or time period
-
Instantly update all visuals
KPI Cards
-
Total Planned Budget
-
Total Actual Cost
-
Number of Active Projects
-
Delayed Project Percentage
Core Charts on the Overview Page
-
Planned Budget by Clinic Name – Compare budget allocation across clinics
-
Delayed Project % – Quickly identify schedule risks
-
High Risk Level by Clinic Type – Highlight clinics with critical exposure
-
Actual Cost by Project Name – Spot cost-intensive projects
Because everything appears on one screen, leadership gets clarity within seconds.
2. How Does the Department Analysis Page Help Clinics?
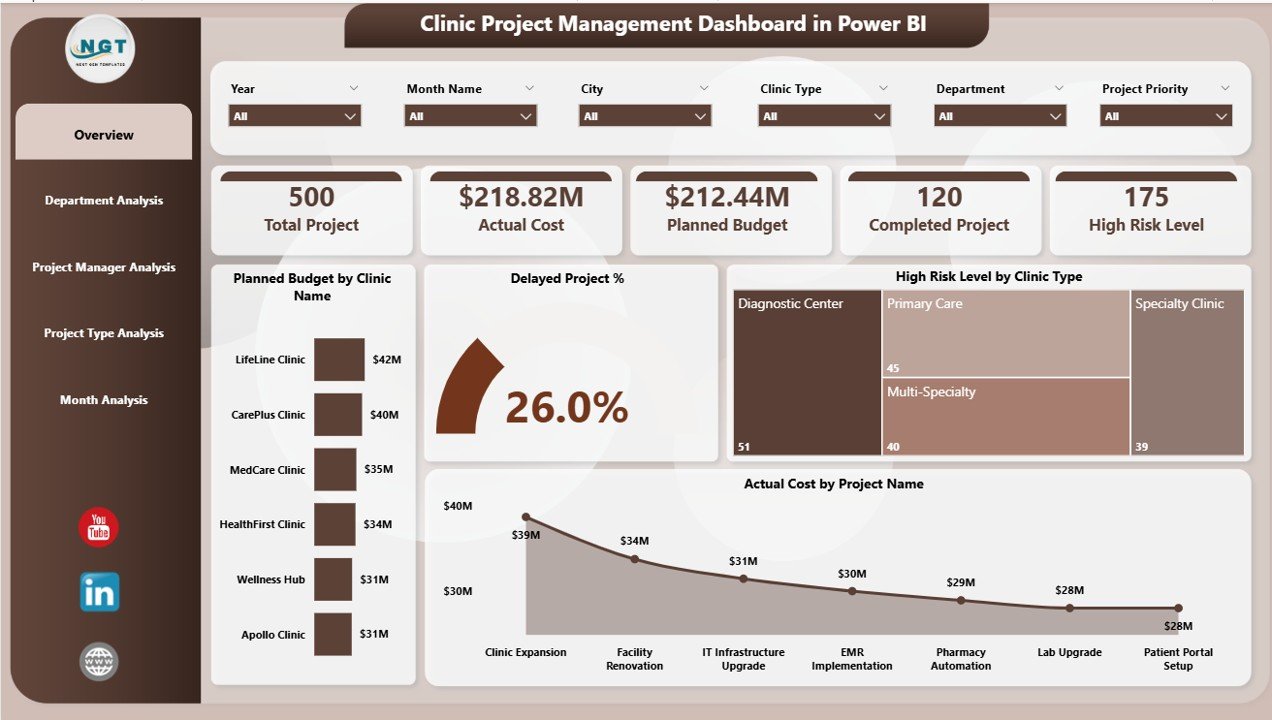
The Department Analysis Page focuses on how individual departments perform across projects.
Why Department Analysis Matters
Departments such as IT, Facilities, Administration, and Clinical Operations play different roles in projects. Therefore, performance varies significantly.
Key Visuals on the Department Analysis Page
-
Planned Budget by Department – Understand budget ownership
-
Completed Projects by Department – Measure execution efficiency
-
Actual Cost by Department – Detect overspending areas
-
Click to Purchases Clinic Project Management Dashboard in Power BI
With this page, clinic leaders clearly see which departments deliver results and which ones need support.
3. Why Is Project Manager Analysis Important in Clinics?
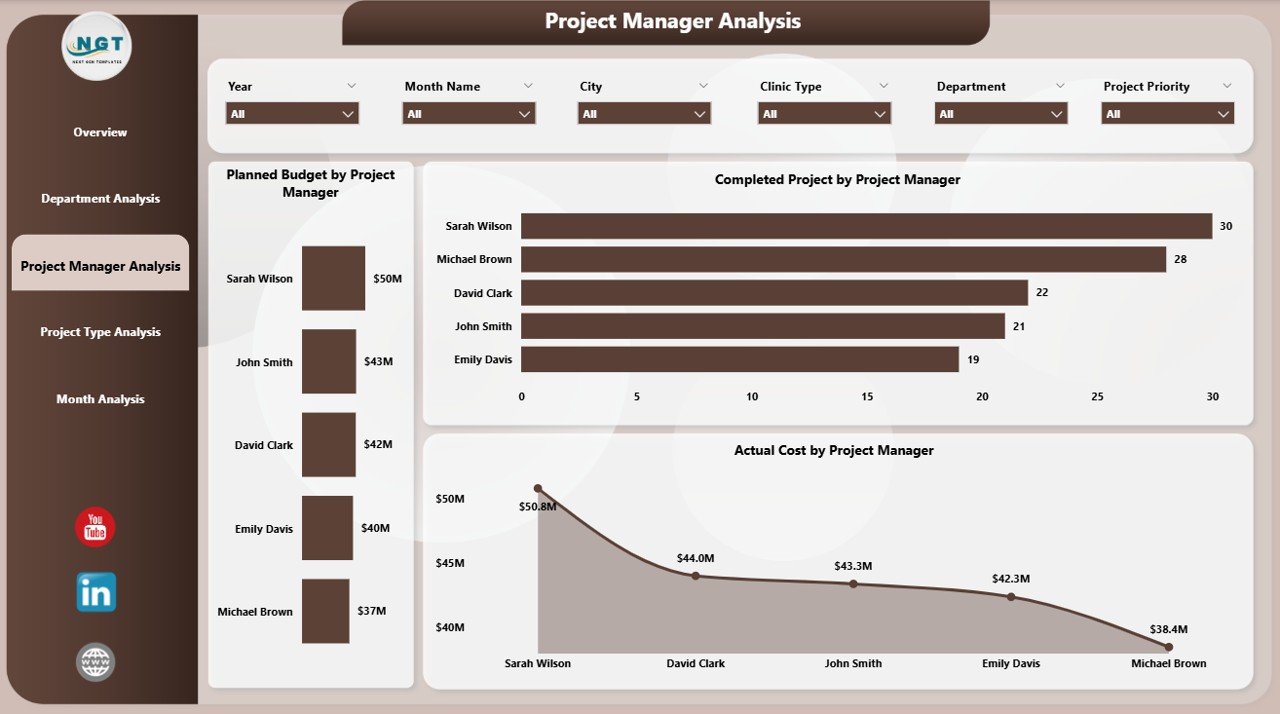
Projects succeed or fail based on leadership. That is why the Project Manager Analysis Page plays a crucial role.
Insights Delivered by This Page
-
Compare performance across project managers
-
Identify high-performing leaders
-
Detect workload imbalance
Key Charts on the Project Manager Analysis Page
-
Planned Budget by Project Manager – Budget responsibility distribution
-
Completed Projects by Project Manager – Delivery effectiveness
-
Actual Cost by Project Manager – Cost control capability
As a result, clinics assign future projects more strategically.
4. What Does the Project Type Analysis Page Reveal?
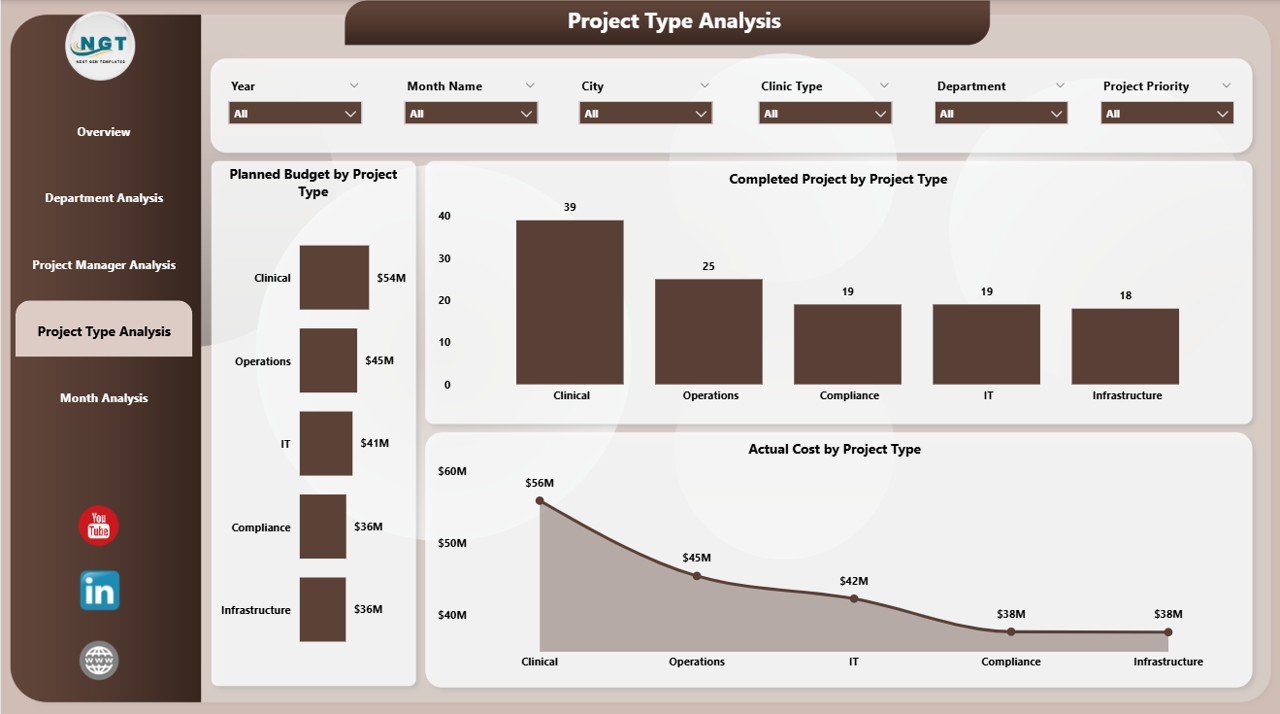
Clinics manage multiple project types, such as infrastructure upgrades, IT implementations, compliance initiatives, and equipment installations.
The Project Type Analysis Page evaluates performance across these categories.
Charts Included on This Page
-
Planned Budget by Project Type – Investment priorities
-
Completed Projects by Project Type – Execution success rate
-
Actual Cost by Project Type – Cost behavior patterns
Because of this analysis, clinics optimize investment decisions across project categories.
Click to Purchases Clinic Project Management Dashboard in Power BI
5. How Does the Monthly Trends Page Support Better Decisions?
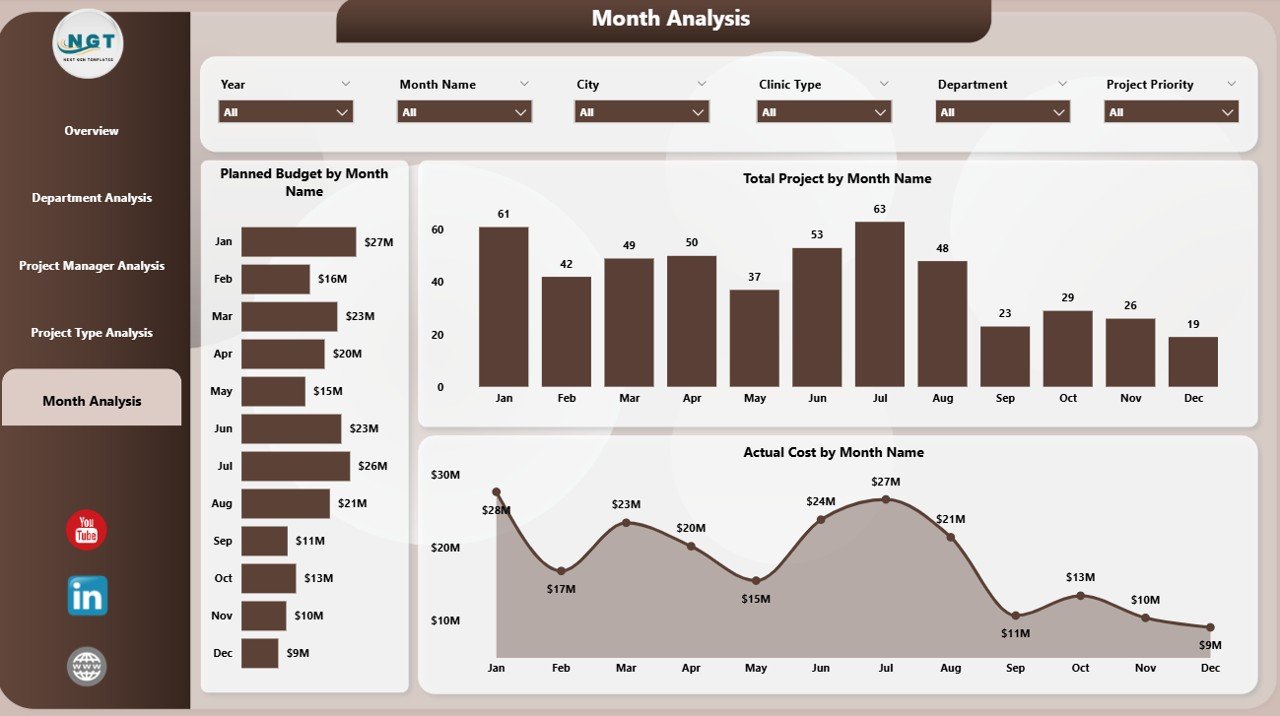
The Monthly Trends Page focuses on time-based analysis. It shows how project performance evolves month by month.
Key Monthly Trend Charts
-
Planned Budget by Month – Budget planning consistency
-
Total Projects by Month – Workload fluctuations
-
Actual Cost by Month – Spending patterns
With trend analysis, clinics forecast future risks instead of reacting late.
Which KPIs Are Commonly Used in a Clinic Project Management Dashboard?
A strong dashboard relies on meaningful KPIs. Common KPIs include:
-
Planned Budget
-
Actual Cost
-
Budget Variance
-
Project Completion %
-
Delayed Project %
-
High-Risk Project Count
-
Cost Overrun %
-
Projects by Status (Planned, In Progress, Completed)
These KPIs align directly with clinic operational and financial goals.
Advantages of a Clinic Project Management Dashboard in Power BI
1. Why Does It Improve Project Visibility?
The dashboard centralizes all project data. Therefore, teams no longer search across files. Everyone sees the same truth.
2. How Does It Support Faster Decision-Making?
Because Power BI updates visuals instantly, leaders respond quickly to risks, delays, and cost overruns.
3. Why Does It Enhance Budget Control?
Real-time budget vs actual analysis highlights overspending early. Consequently, clinics take corrective action before losses grow.
4. How Does It Improve Accountability?
Clear ownership by department and project manager creates responsibility. As a result, performance improves naturally.
5. Why Is It Cost-Effective?
Power BI reduces manual reporting effort. Therefore, clinics save time and operational costs while improving insights.
Opportunities for Improvement in Clinic Project Dashboards
Although dashboards deliver strong value, clinics can further enhance them:
-
Add forecasted cost and completion dates
-
Integrate risk mitigation actions
-
Include vendor performance metrics
-
Enable row-level security for sensitive data
-
Automate data refresh schedules
By continuously improving, clinics maximize dashboard ROI.
Best Practices for the Clinic Project Management Dashboard in Power BI
1. How Should Clinics Design KPIs?
Always align KPIs with clinic goals. Avoid vanity metrics. Focus on budget, time, and risk.
2. Why Should Data Be Clean and Structured?
Clean data ensures accurate insights. Therefore, validate data sources regularly.
3. How Can Clinics Improve Dashboard Usability?
Use simple layouts, consistent colors, and clear labels. Moreover, avoid overcrowding visuals.
4. Why Are Slicers Important?
Slicers empower users. They allow instant filtering without technical knowledge.
5. How Often Should Clinics Review the Dashboard?
Review dashboards weekly or monthly. Frequent review drives proactive management.
Click to Purchases Clinic Project Management Dashboard in Power BI
Who Can Benefit from a Clinic Project Management Dashboard in Power BI?
This dashboard benefits multiple stakeholders:
-
Clinic Administrators
-
Project Managers
-
Finance Teams
-
Operations Heads
-
Executive Leadership
Because everyone uses the same data, alignment improves across the organization.
How Does Power BI Add More Value Compared to Excel?
While Excel works well for data entry, Power BI excels in analytics.
Power BI offers:
-
Interactive visuals
-
Drill-down analysis
-
Real-time updates
-
Secure data sharing
-
Scalable performance
Therefore, Power BI fits modern clinic project environments perfectly.
Conclusion: Why Is a Clinic Project Management Dashboard in Power BI Essential?
A Clinic Project Management Dashboard in Power BI transforms how clinics manage projects. Instead of relying on fragmented reports, clinics gain a centralized, interactive, and decision-ready platform.
With structured pages like Overview, Department Analysis, Project Manager Analysis, Project Type Analysis, and Monthly Trends, clinics achieve complete project visibility. As a result, budgets remain under control, risks stay visible, and projects deliver on time.
In today’s data-driven healthcare environment, this dashboard is no longer optional. It is essential.
Frequently Asked Questions (FAQs)
What is a Clinic Project Management Dashboard in Power BI?
It is an interactive Power BI dashboard that tracks clinic project budgets, costs, timelines, risks, and performance in one place.
Can small clinics use this dashboard?
Yes. Small clinics benefit significantly because it simplifies reporting and improves budget control.
What data sources can Power BI connect to?
Power BI connects to Excel, SharePoint, SQL databases, cloud platforms, and more.
Does this dashboard require advanced technical skills?
No. End users interact through slicers and visuals without technical expertise.
How often should clinics update the dashboard?
Ideally, clinics should refresh data daily or weekly for accurate insights.
Can clinics customize KPIs and visuals?
Yes. Power BI allows full customization based on clinic requirements.
Visit our YouTube channel to learn step-by-step video tutorials