In today’s competitive business environment, customer satisfaction is no longer optional—it is the foundation of growth and sustainability. When customers face problems with products or services, the way an organization responds can make or break long-term loyalty. This is why customer complaint resolution has become one of the most critical aspects of customer service strategy.
But how do businesses measure and improve the way they handle complaints? The answer lies in KPI dashboards. A Customer Complaint Resolution KPI Dashboard in Excel provides a clear, structured, and data-driven view of how well complaints are being managed. It helps teams track performance, identify trends, and take corrective action to reduce customer churn.
In this article, we will explore everything about the Customer Complaint Resolution KPI Dashboard in Excel—from its structure and features to its advantages, best practices, and common questions.
Click to buy now Customer Complaint Resolution KPI Dashboard In Excel
What Is a Customer Complaint Resolution KPI Dashboard?
A Customer Complaint Resolution KPI Dashboard is a digital reporting tool designed to monitor and evaluate how effectively a business resolves customer issues. Built in Excel, it consolidates multiple KPIs (Key Performance Indicators) into one central platform.
Instead of manually checking scattered records, managers can now:
- Track the volume of complaints
- Measure resolution time
- Compare current performance with past results
- Identify areas that need improvement
This makes the dashboard not just a reporting tool, but also a decision-making companion for customer service leaders.
Key Features of the Dashboard
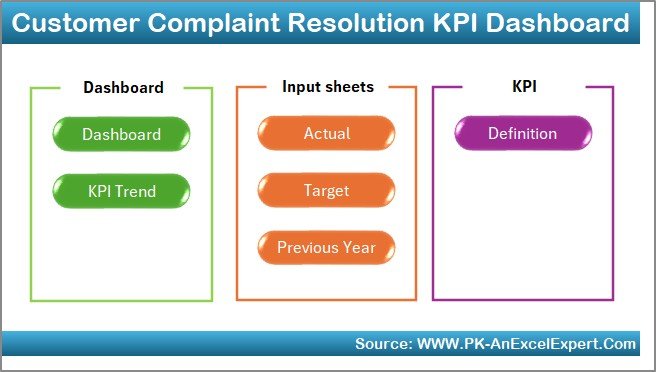
The Customer Complaint Resolution KPI Dashboard in Excel is designed with seven interconnected worksheets, each with a specific role. Let’s explore them in detail.
- Home Sheet
- Functions as the index page for the dashboard.
- Includes six navigation buttons that allow users to move easily to different sheets.
- Saves time and makes the tool user-friendly for all team members.
Click to buy now Customer Complaint Resolution KPI Dashboard In Excel
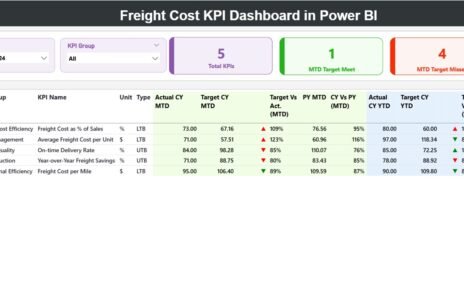
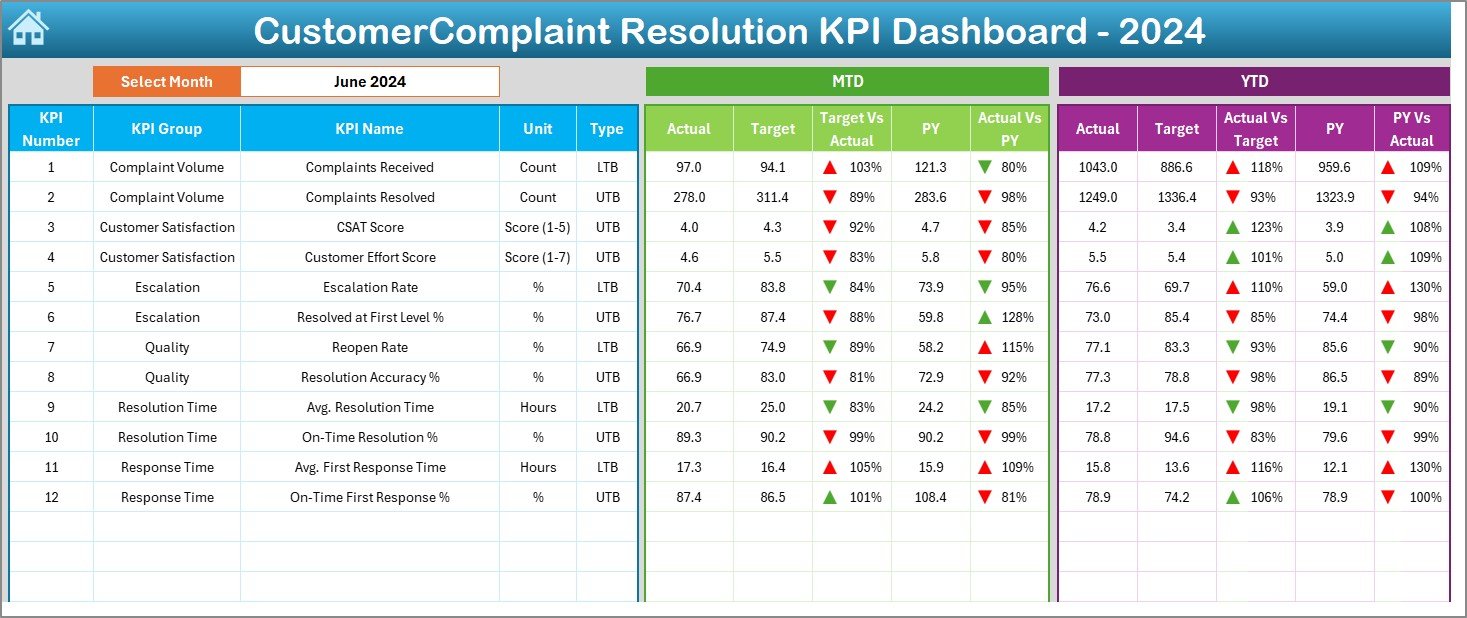
- Dashboard Sheet Tab
- Acts as the main visualization hub.
- Users can select the month from a drop-down list (cell D3). Once selected, all numbers update instantly.
- Displays MTD (Month-to-Date) Actual vs Target vs Previous Year (PY) along with conditional formatting arrows (green for improvement, red for decline).
- Also provides YTD (Year-to-Date) comparisons to ensure long-term performance monitoring.
Click to buy now Customer Complaint Resolution KPI Dashboard In Excel
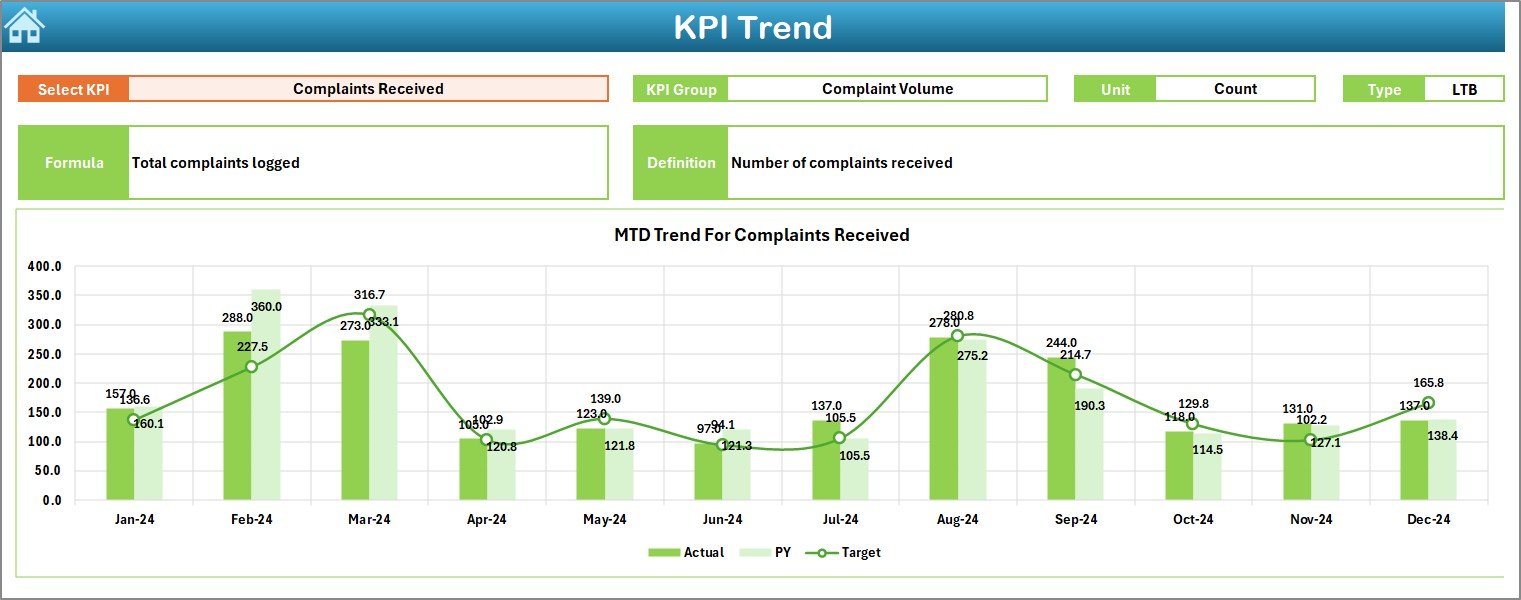
KPI Trend Sheet Tab
- Focuses on individual KPI analysis.
- Drop-down in cell C3 allows users to select a specific KPI.
- Displays key attributes such as KPI Group, Unit, Type (Lower the Better or Upper the Better), Formula, and Definition.
- Includes dynamic trend charts for both MTD and YTD, helping managers visualize performance patterns.
Click to buy now Customer Complaint Resolution KPI Dashboard In Excel
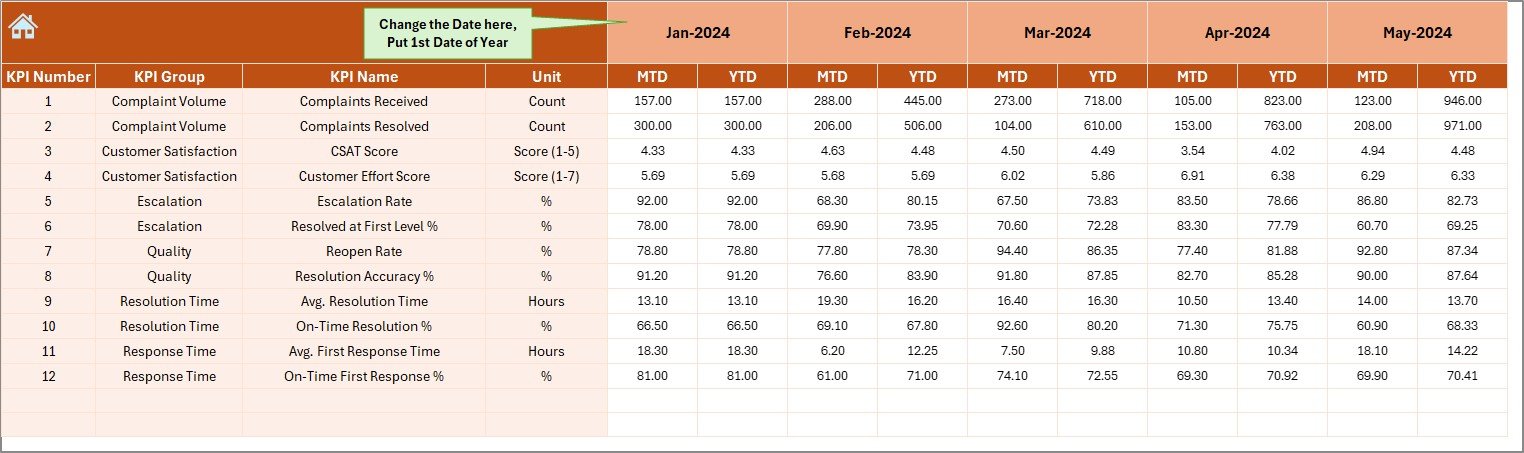
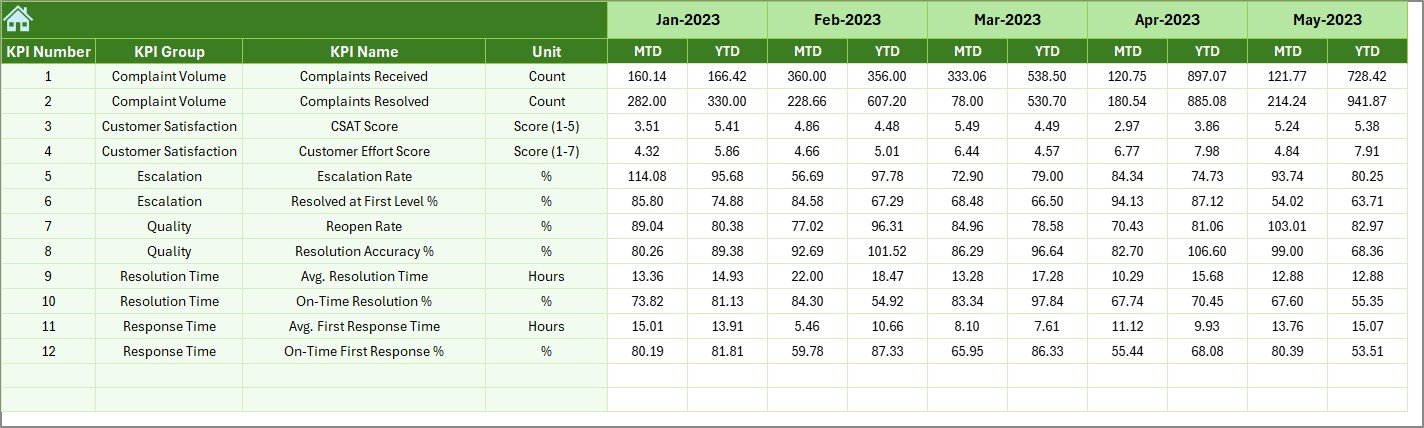
Actual Numbers Input Sheet
- The data entry sheet for actual performance.
- Users can input MTD and YTD figures month by month.
- Range E1 allows setting the first month of the year, making it flexible for organizations following different fiscal calendars.
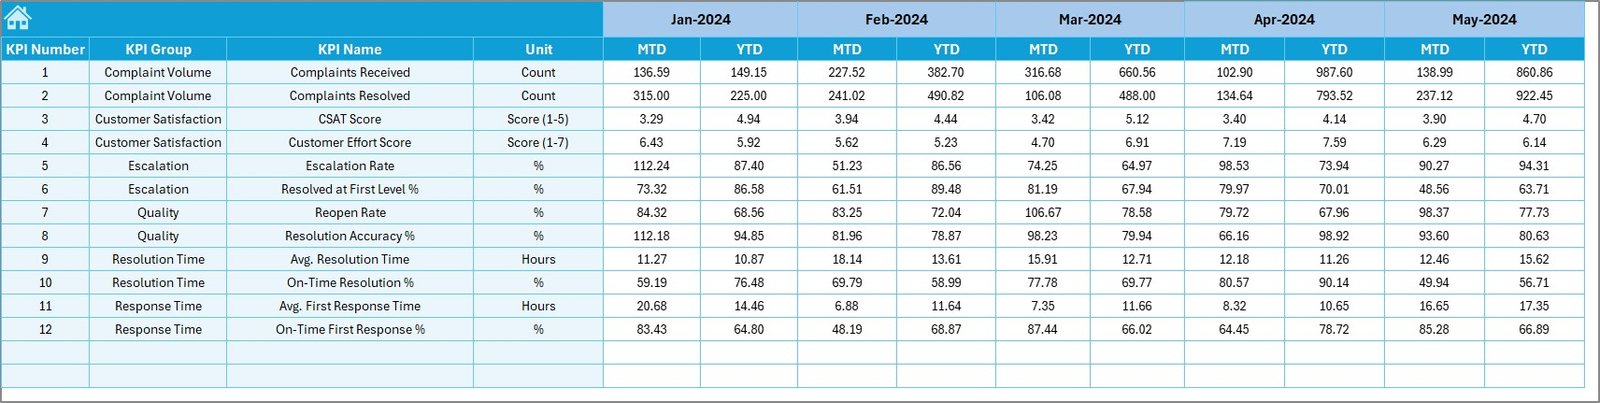
Target Sheet Tab
- Stores monthly target values for all KPIs.
- Both MTD and YTD targets can be entered.
- Helps set clear expectations and benchmarks for the team.
Previous Year Number Sheet
- Captures historical performance for comparison.
- Ensures organizations can analyze whether improvements are being made year-on-year.
- Acts as a valuable reference point during performance reviews.
Click to buy now Customer Complaint Resolution KPI Dashboard In Excel
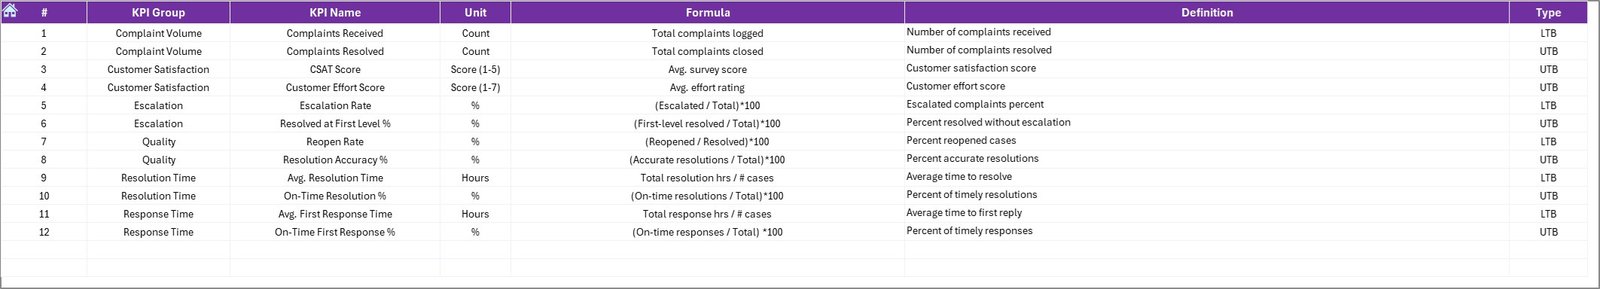
KPI Definition Sheet Tab
- Provides a reference library of KPIs.
- Columns include KPI Name, KPI Group, Unit, Formula, and Definition.
- Ensures everyone on the team understands each KPI in the same way
Click to buy now Customer Complaint Resolution KPI Dashboard In Excel
Why Do Businesses Need This Dashboard?
Managing customer complaints without proper data insights is like sailing without a compass. Here’s why this dashboard matters:
- Accountability: Tracks who is responsible for resolving issues.
- Transparency: Shows clear data to management and stakeholders.
- Efficiency: Highlights bottlenecks and delays in resolution.
- Customer Retention: Faster and better complaint resolution builds loyalty.
- Continuous Improvement: Historical data helps identify recurring issues.
Key KPIs to Track in Customer Complaint Resolution
A dashboard is only as useful as the KPIs it includes. Common metrics that organizations monitor include:
- Average Resolution Time – Time taken to resolve complaints.
- First Contact Resolution (FCR) – % of complaints resolved in the first interaction.
- Escalation Rate – % of cases that required higher-level intervention.
- Pending Complaints – Complaints still awaiting resolution.
- Reopened Cases – Complaints that were marked resolved but reappeared.
- Customer Satisfaction Score (CSAT) – Customer rating after resolution.
- Complaint Volume by Category – Classification of issues (billing, product defect, service delay, etc.).
- Resolution Progress % – Percentage of complaints resolved vs total received.
Each of these KPIs provides insights into both efficiency and customer experience.
Advantages of Customer Complaint Resolution KPI Dashboard
Click to buy now Customer Complaint Resolution KPI Dashboard In Excel
Using this dashboard offers multiple benefits:
- Real-Time Insights – Updated monthly and year-to-date data.
- Improved Decision-Making – Helps prioritize resources effectively.
- Enhanced Team Performance – Clear targets and results motivate staff.
- Reduced Customer Churn – Faster complaint resolution improves satisfaction.
- Standardized Measurement – Everyone tracks KPIs consistently.
- Better Forecasting – Trends highlight future complaint risks.
Opportunities for Improvement
Even though the dashboard is powerful, organizations can further improve it by:
- Integrating with CRM tools like Salesforce or Zoho for real-time data flow.
- Automating email alerts for escalated or overdue complaints.
- Adding root cause analysis charts to identify common problem areas.
- Using Power BI integration for more advanced visualizations.
- Expanding to track multi-channel complaints (phone, email, chat, social media).
Best Practices for the Customer Complaint Resolution KPI Dashboard
Click to buy now Customer Complaint Resolution KPI Dashboard In Excel
To get the most value from the dashboard, organizations should follow these practices:
- Keep Data Clean
- Ensure inputs in Actual, Target, and Previous Year sheets are accurate.
- Review Regularly
- Schedule monthly reviews to track trends and corrective actions.
- Focus on Actionable KPIs
- Track only the most impactful KPIs to avoid overwhelming users.
- Train the Team
- Provide training on how to use the dashboard and interpret results.
- Customize for Business Needs
- Adapt KPIs and formats based on industry, customer base, and complaint types.
How This Dashboard Supports Decision-Making
Decision-makers can leverage this dashboard for:
- Strategic Planning: Aligning complaint resolution with company goals.
- Operational Efficiency: Spotting delays in workflows.
- Customer Experience: Identifying dissatisfaction trends before they escalate.
- Compliance & Reporting: Demonstrating accountability to regulators.
Conclusion
Click to buy now Customer Complaint Resolution KPI Dashboard In Excel
A Customer Complaint Resolution KPI Dashboard in Excel empowers organizations to transform how they handle customer issues. By consolidating critical metrics, providing trend insights, and enabling comparisons against targets and previous years, the dashboard becomes a powerful tool for customer service excellence.
When used effectively, it ensures that complaints are not just resolved—but resolved quickly, efficiently, and in a way that strengthens customer trust.
Frequently Asked Questions (FAQs)
- What is a Customer Complaint Resolution KPI Dashboard?
It is an Excel-based tool that tracks KPIs related to customer complaint management, helping businesses improve resolution efficiency.
- Which KPIs are most important to include?
Common KPIs include resolution time, first contact resolution, escalation rate, CSAT, and reopened cases.
- Can this dashboard be customized?
Yes. Businesses can modify KPIs, targets, and formats based on their unique requirements.
- How often should we update the data?
Ideally, update the dashboard monthly to ensure accuracy and meaningful comparisons.
- Is Excel enough, or should we use Power BI?
Excel works well for small to medium datasets. For advanced, real-time analytics, integration with tools like Power BI is recommended.
- Can it track multi-channel complaints?
Yes, if data is collected from all channels (phone, chat, email, etc.) and entered into the Actual Numbers Input sheet.
- How does it improve customer retention?
Faster and more accurate resolution leads to happier customers, reducing churn and increasing loyalty.
Visit our YouTube channel to learn step-by-step video tutorials
Watch the step-by-step video tutorial:
Click to buy now Customer Complaint Resolution KPI Dashboard In Excel