Managing purchasing operations in the healthcare industry is never simple. Hospitals, clinics, and healthcare organizations handle thousands of purchases every month, including medicines, medical equipment, consumables, and services. Therefore, tracking costs, vendor performance, and purchasing efficiency becomes critical.
That is exactly where the Health Purchasing KPI Dashboard in Excel plays a powerful role.
In this detailed article, you will learn everything about the Health Purchasing KPI Dashboard in Excel, including its structure, features, benefits, use cases, advantages, and best practices. Moreover, this guide explains how healthcare organizations can use this dashboard to improve purchasing control, reduce costs, and make data-driven decisions.
Click to buy Health Purchasing KPI Dashboard in Excel
What Is a Health Purchasing KPI Dashboard in Excel?
A Health Purchasing KPI Dashboard in Excel is a centralized analytical tool that helps healthcare organizations track, monitor, and analyze purchasing performance using key performance indicators (KPIs).
Instead of managing multiple spreadsheets, emails, and reports, this dashboard combines all purchasing-related data into one structured Excel file. As a result, procurement teams can track costs, analyze trends, measure efficiency, and improve supplier performance with ease.
Moreover, since the dashboard works entirely in Excel, users do not need advanced BI tools or technical knowledge.
Why Do Healthcare Organizations Need a Purchasing KPI Dashboard?
Healthcare procurement involves complex processes. Therefore, managing them manually often leads to errors, delays, and higher costs.
Here’s why a Health Purchasing KPI Dashboard becomes essential:
- It improves visibility into purchasing performance
- It helps control procurement costs
- It supports data-driven decision-making
- It reduces manual reporting effort
- It improves supplier and inventory management
- It ensures better budget utilization
Most importantly, it allows management to monitor performance in real time and act quickly when issues arise.
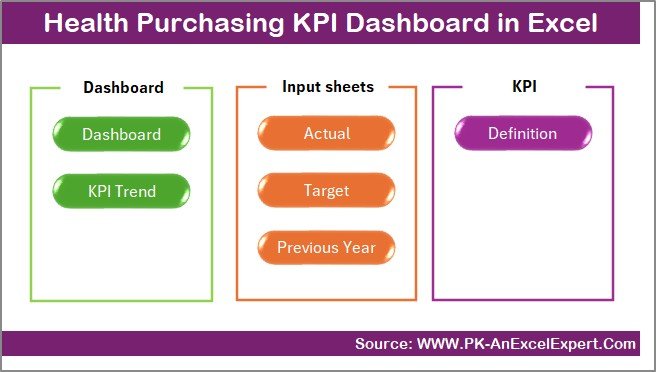
Overview of Health Purchasing KPI Dashboard Structure
This Health Purchasing KPI Dashboard in Excel is designed with 7 structured worksheets, each serving a specific purpose. Let’s understand each sheet in detail.
Summary Page – Dashboard Navigation Hub
The Summary Page acts as the index of the dashboard.
Key Features:
- Acts as a navigation panel
- Contains 6 interactive buttons
- Allows users to jump to any dashboard section instantly
- Improves usability and user experience
Why This Page Matters:
- Saves time navigating large Excel files
- Makes the dashboard user-friendly
- Helps non-technical users access data easily
This page ensures smooth movement across all KPI sections without confusion.
Click to buy Health Purchasing KPI Dashboard in Excel
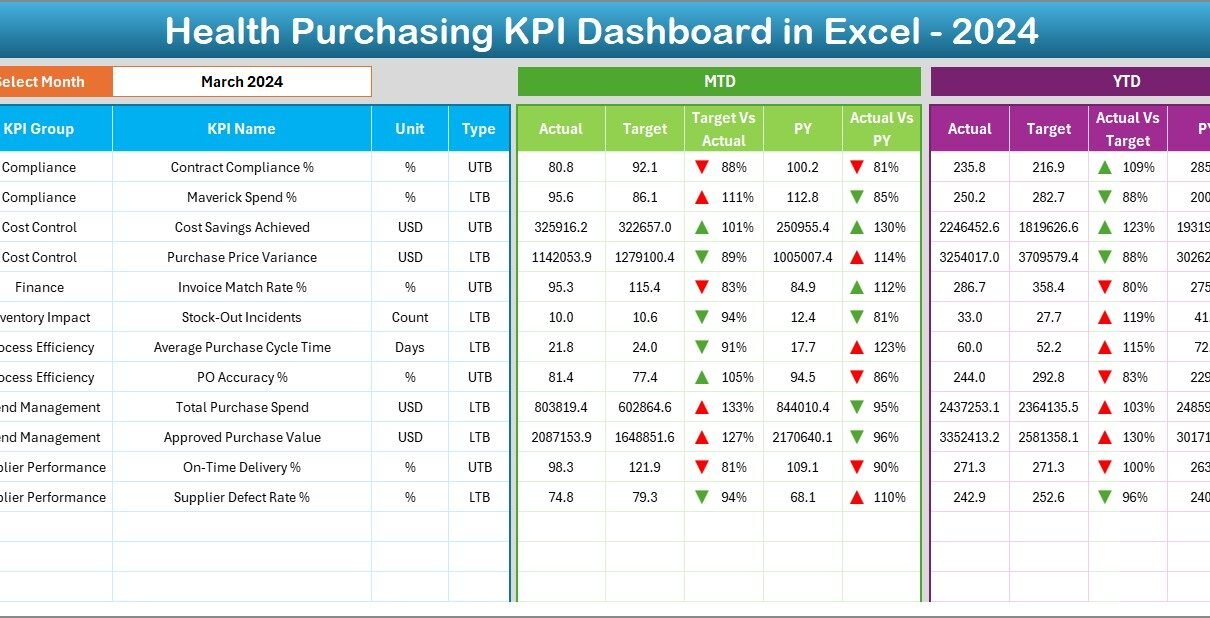
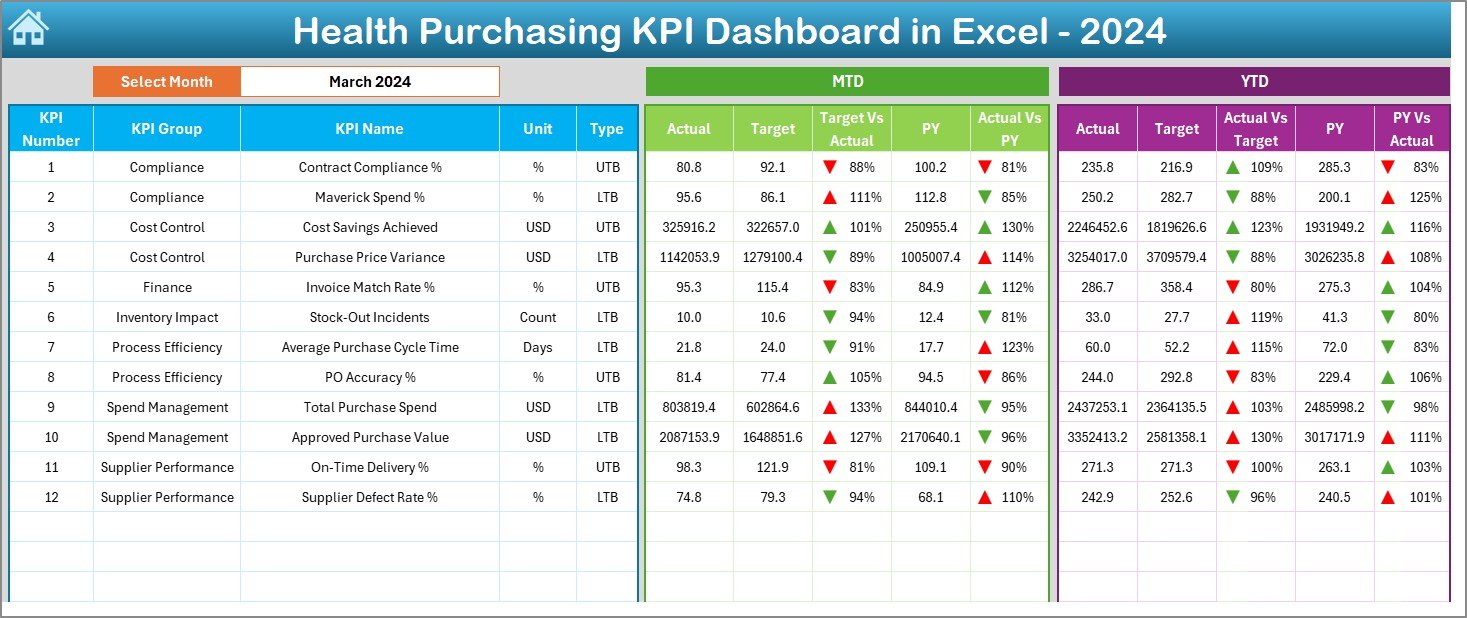
Dashboard Sheet – Central KPI Monitoring Page
The Dashboard Sheet is the core of the Health Purchasing KPI Dashboard.
Key Highlights:
- Displays all purchasing KPIs in one place
- Uses a Month selector (Cell D3) to change reporting period
- Automatically updates all values when the month changes
- Shows visual performance indicators
KPIs Displayed:
- MTD Actual
- MTD Target
- Previous Year (PY)
- Target vs Actual
- PY vs Actual
- YTD Actual
- YTD Target
- YTD PY Comparison
Visual Features:
- Conditional formatting with up/down arrows
- Easy-to-read KPI cards
- Color-coded performance indicators
This dashboard allows management to identify underperformance or improvement areas instantly.
Click to buy Health Purchasing KPI Dashboard in Excel
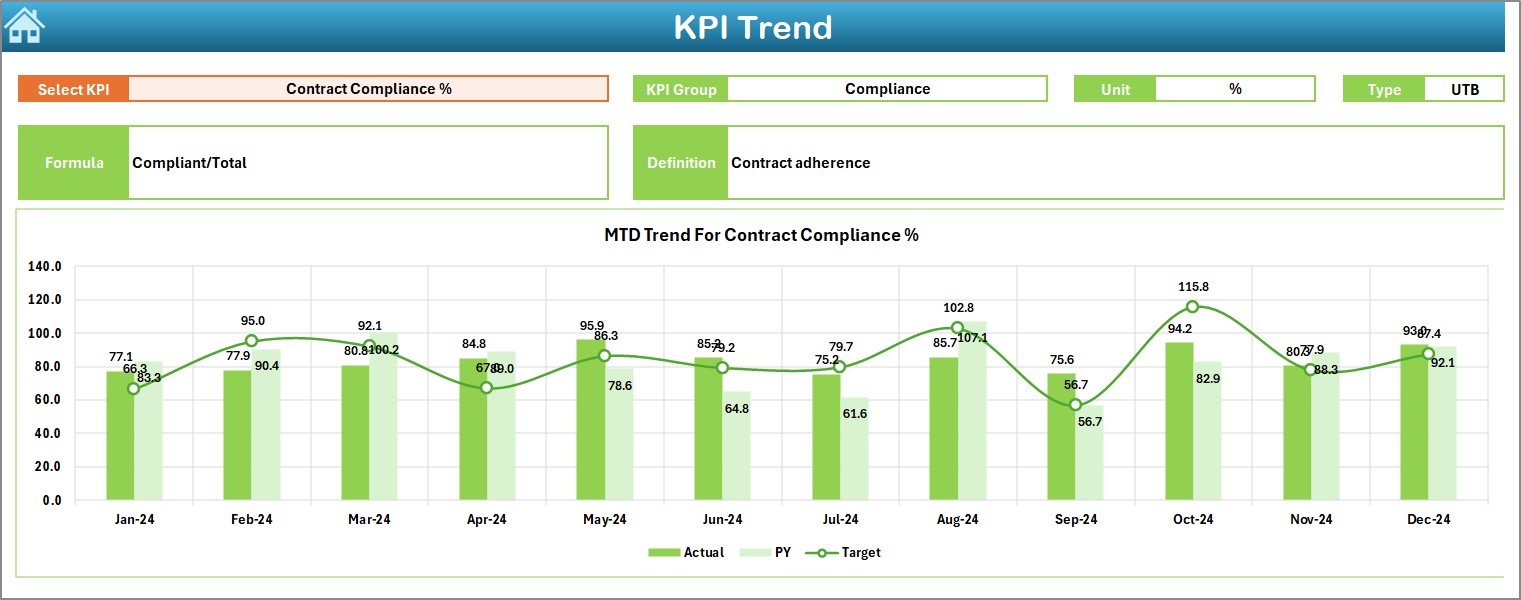
Trend Sheet – KPI Performance Analysis Over Time
The Trend Sheet helps users analyze KPI performance over time.
Key Features:
- KPI selection using dropdown (Cell C3)
Displays:
KPI Group
KPI Unit
KPI Type (LTB / UTB)
KPI Formula
KPI Definition
Trend Analysis:
- Monthly trend for:
Actual
Target
Previous Year
Year-to-Date (YTD) trend comparison
Visual charts for quick insights
Why This Sheet Is Important:
- Helps identify performance patterns
- Supports forecasting and planning
- Highlights improvement or decline trends
Click to buy Health Purchasing KPI Dashboard in Excel
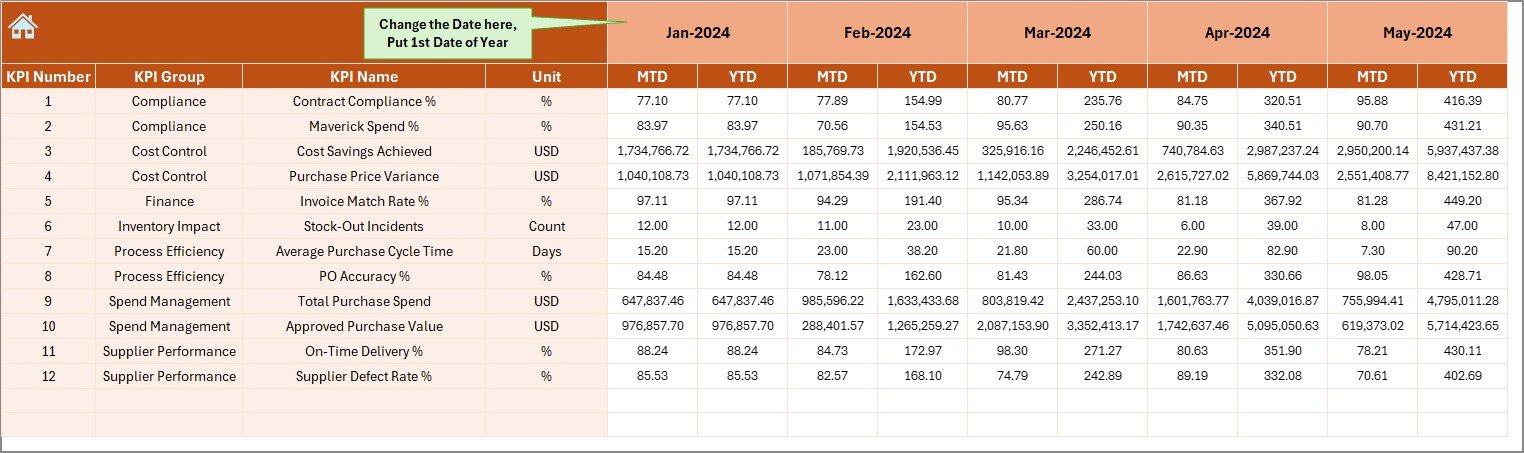
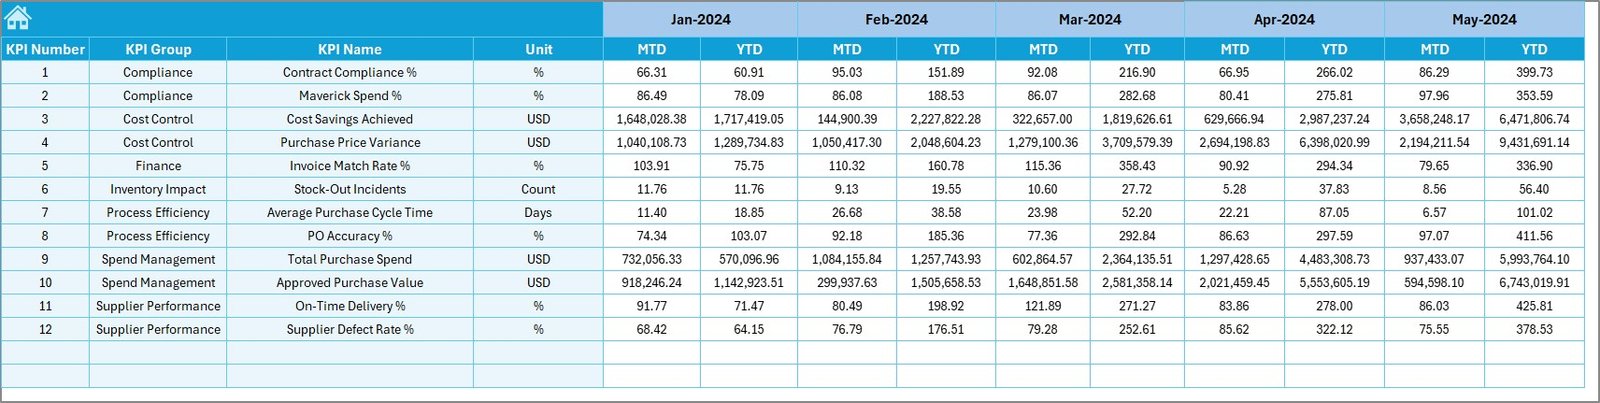
Actual Numbers Input Sheet
This sheet captures the actual purchasing data.
Key Inputs:
- Monthly MTD values
- Year-to-Date (YTD) values
- Month selection from Cell E1
How It Works:
- Enter the first month of the year
- Input monthly purchasing values
- Dashboard updates automatically
Benefits:
- Easy data entry
- Structured input format
- Reduces data entry errors
Click to buy Health Purchasing KPI Dashboard in Excel
Target Sheet – Performance Benchmarking
The Target Sheet stores planned or expected values for each KPI.
What You Enter:
- Monthly target values
- YTD target values
- KPI-wise performance goals
Why It Matters:
- Helps compare actual vs target
- Supports performance evaluation
- Enables proactive decision-making
Click to buy Health Purchasing KPI Dashboard in Excel
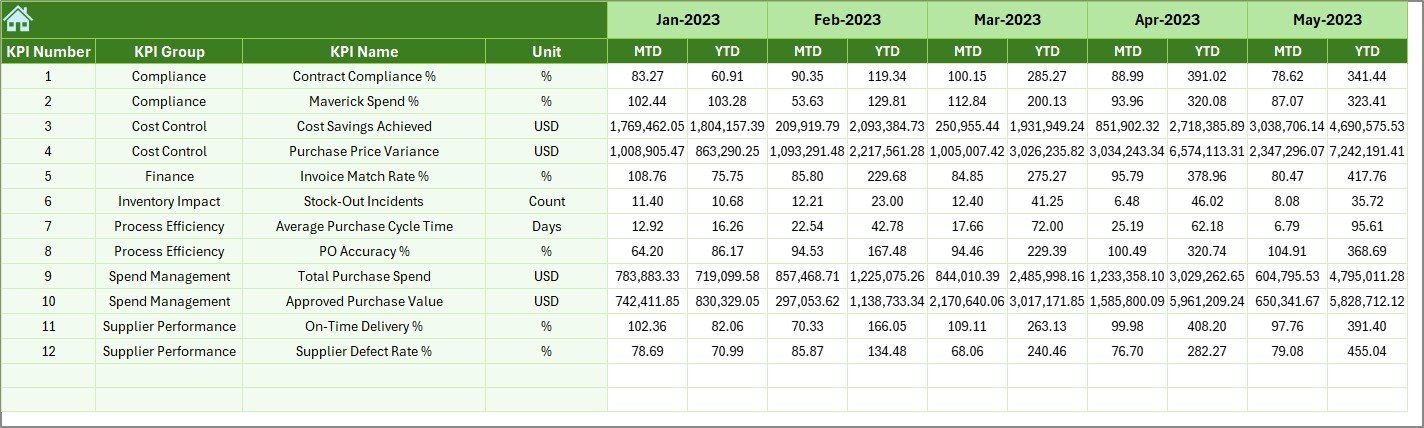
Previous Year Data Sheet
This sheet stores historical data for comparison.
Purpose:
- Track year-over-year performance
- Analyze purchasing trends
- Measure growth or decline
Key Benefit:
Organizations can easily understand whether performance has improved or declined compared to the previous year.
Click to buy Health Purchasing KPI Dashboard in Excel
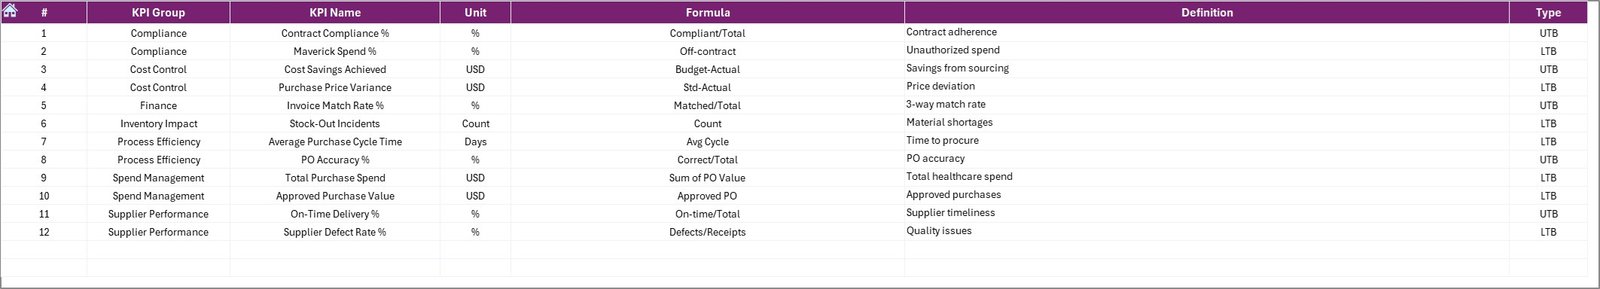
KPI Definition Sheet
This sheet acts as a data dictionary.
Contains:
- KPI Name
- KPI Group
- KPI Unit
- KPI Formula
- KPI Definition
- KPI Type (LTB or UTB)
Why This Sheet Is Important:
- Ensures clarity and consistency
- Helps new users understand KPIs
- Standardizes KPI definitions across teams
Click to buy Health Purchasing KPI Dashboard in Excel
Advantages of Health Purchasing KPI Dashboard in Excel
Centralized Data Management
All purchasing data stays in one structured file, reducing confusion and duplication.
Improved Decision-Making
Visual KPIs allow quick analysis and faster decisions.
Time-Saving Reporting
Automated calculations eliminate manual reporting.
Cost Control
Helps identify overspending and inefficiencies.
Easy Customization
You can modify KPIs, formulas, and visuals easily.
No Advanced Tools Required
Works entirely in Microsoft Excel.
Better Vendor Management
Tracks vendor-related KPIs for better negotiations.
How Does This Dashboard Help Healthcare Organizations?
This dashboard supports healthcare organizations in:
- Monitoring purchasing efficiency
- Controlling procurement costs
- Improving budget planning
- Reducing wastage
- Tracking supplier performance
- Improving audit readiness
- Enhancing transparency
As a result, procurement teams work smarter and faster.
Best Practices for Using Health Purchasing KPI Dashboard in Excel
Keep Data Updated Regularly
Update actual and target values monthly to ensure accuracy.
Use Consistent KPI Definitions
Avoid confusion by using standardized KPI definitions.
Validate Data Before Entry
Ensure accuracy to prevent misleading insights.
Review Trends Monthly
Use trend charts to identify performance gaps early.
Use Targets Strategically
Set realistic targets aligned with organizational goals.
Train Users Properly
Ensure all users understand how to enter and interpret data.
Maintain Data Security
Restrict editing rights to authorized users.
Who Can Use This Dashboard?
This dashboard is ideal for:
- Hospital Procurement Teams
- Healthcare Finance Departments
- Supply Chain Managers
- Purchasing Managers
- Hospital Administrators
- Healthcare Consultants
- Audit and Compliance Teams
Why Excel Is the Best Tool for Purchasing KPI Dashboards
Excel remains one of the most powerful tools for KPI management because:
- It is widely used and accessible
- It supports formulas, charts, and automation
- It allows customization
- It requires no additional software
- It integrates easily with other systems
Therefore, Excel remains a smart choice for healthcare KPI tracking.
Conclusion
The Health Purchasing KPI Dashboard in Excel is a powerful, practical, and easy-to-use solution for managing healthcare procurement performance. It helps organizations track costs, analyze trends, measure efficiency, and make informed decisions using real-time data.
With structured worksheets, dynamic dashboards, and clear visual indicators, this dashboard simplifies complex purchasing data into meaningful insights. Moreover, its flexibility allows healthcare teams to customize it based on their operational needs.
If you want better control over purchasing, improved transparency, and smarter decision-making, this dashboard becomes an essential tool for your organization.
Frequently Asked Questions (FAQs)
- What is a Health Purchasing KPI Dashboard in Excel?
A Health Purchasing KPI Dashboard in Excel is a tool that tracks and analyzes healthcare purchasing performance using KPIs such as cost, targets, and trends.
- Can I customize the dashboard KPIs?
Yes, you can easily customize KPIs, formulas, and targets based on your organization’s needs.
- Do I need advanced Excel knowledge to use this dashboard?
No. The dashboard uses simple Excel features and is designed for easy use.
- How often should I update the dashboard?
You should update it monthly or whenever new purchasing data is available.
- Can I use this dashboard for hospitals and clinics?
Yes, it is suitable for hospitals, clinics, laboratories, and healthcare chains.
- Does the dashboard support trend analysis?
Yes, it includes trend charts for both MTD and YTD performance.
- Can I add more KPIs later?
Absolutely. The KPI Definition sheet allows easy expansion.
- Is this dashboard suitable for audits?
Yes, it improves data transparency and supports audit readiness.
Visit our YouTube channel to learn step-by-step video tutorials
Watch the step-by-step video tutorial:
Click to buy Health Purchasing KPI Dashboard in Excel