In today’s competitive manufacturing landscape, data-driven decision-making is no longer optional—it’s essential. Businesses that track the right metrics can streamline operations, improve efficiency, and boost profitability. One of the most effective tools to achieve this is a Manufacturing KPI Scorecard in Excel
This article will take you through everything you need to know about this ready-to-use scorecard: its features, how it works, advantages, opportunities for improvement, and best practices. Finally, you’ll also find a FAQ section with answers to common questions.Manufacturing KPI Scorecard in Excel
What is a Manufacturing KPI Scorecard in Excel?
A Manufacturing KPI Scorecard in Excel is a performance tracking tool that helps manufacturing organizations monitor their Key Performance Indicators (KPIs) in one centralized dashboard. It provides real-time insights into productivity, efficiency, quality, and resource utilization.
Unlike complex BI tools, this Excel-based scorecard is simple, lightweight, and customizable, making it an excellent choice for small to medium manufacturers who need quick visibility without heavy investment.
Structure of the Manufacturing KPI Scorecard
This scorecard template includes four main sheet tabs:
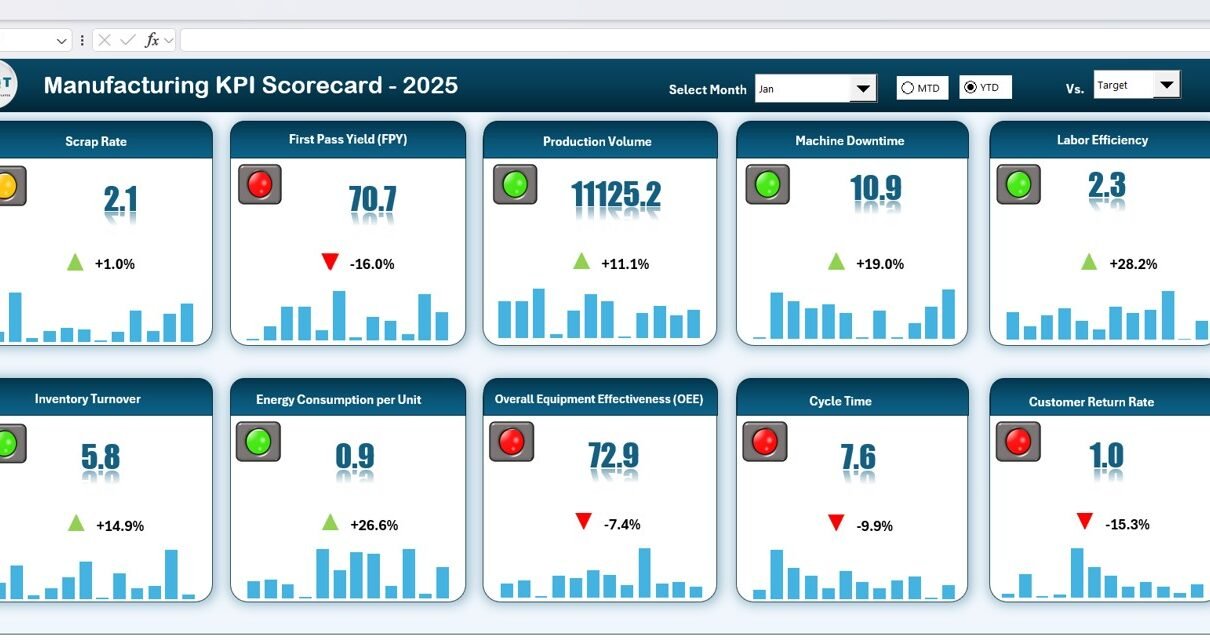
1. Scorecard Sheet Tab
-
This is the main dashboard.
-
It displays KPI performance using cards, charts, and traffic-light indicators (green, yellow, red).
-
The top section has filter buttons to:
- Select the month
- Switch between MTD (Month-to-Date) and YTD (Year-to-Date) views
- Compare Actual vs. Target vs. Previous Year (PY)
Example KPIs displayed:
- Scrap Rate
- First Pass Yield (FPY)
- Production Volume
- Machine Downtime
- Labor Efficiency
- Inventory Turnover
- Energy Consumption per Unit
- Overall Equipment Effectiveness (OEE)
- Cycle Time
- Customer Return Rate

Click to Buy Manufacturing KPI Scorecard in Excel
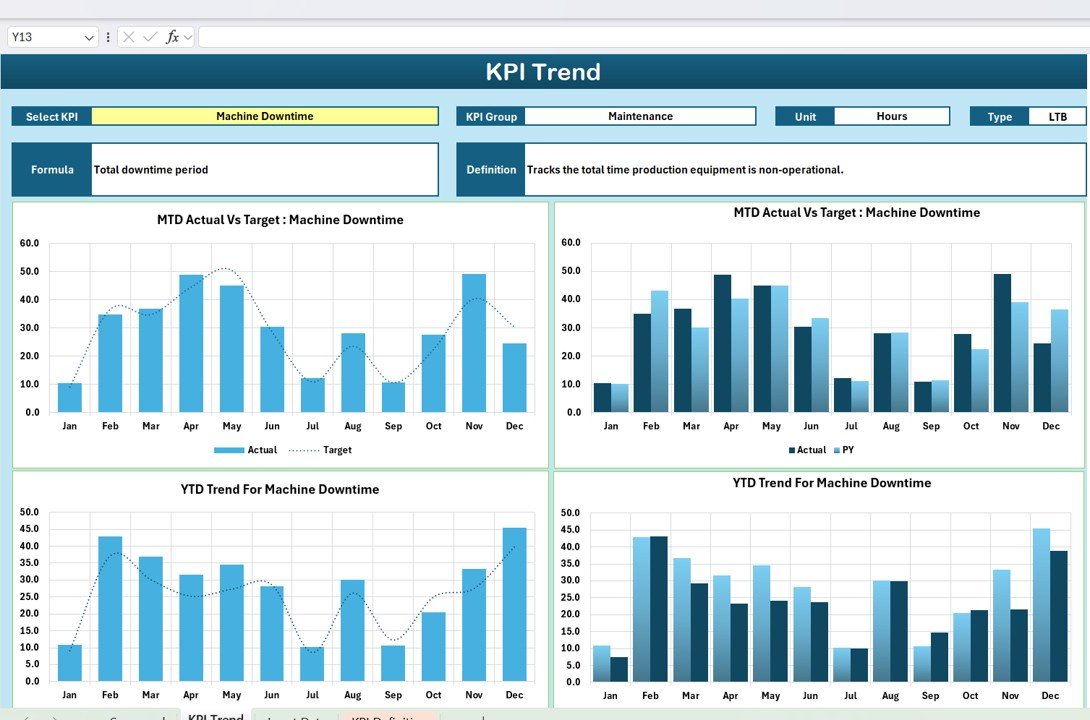
2. KPI Trend Sheet Tab
-
Lets you analyze performance trends for each KPI over time.
-
A dropdown (cell C3) allows you to choose the KPI.
Displays:
- KPI Group (e.g., Quality, Productivity, Efficiency)
- KPI Unit (%, hours, ratio, etc.)
- KPI Type (LTB = Lower the Better, UTB = Upper the Better)
- Formula and Definition
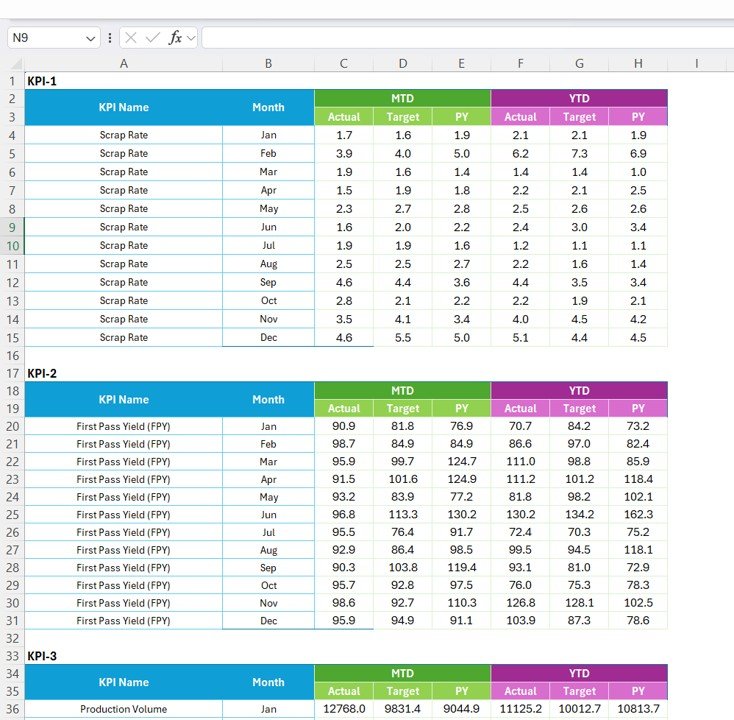
3. Input Data Sheet Tab
-
The data backbone of the scorecard.
-
Stores Actual, Target, and PY values for each KPI month by month.
-
Automatically feeds into the Scorecard and Trend tabs.
This makes it easy to update numbers regularly without changing dashboard formulas.
Click to Buy Manufacturing KPI Scorecard in Excel
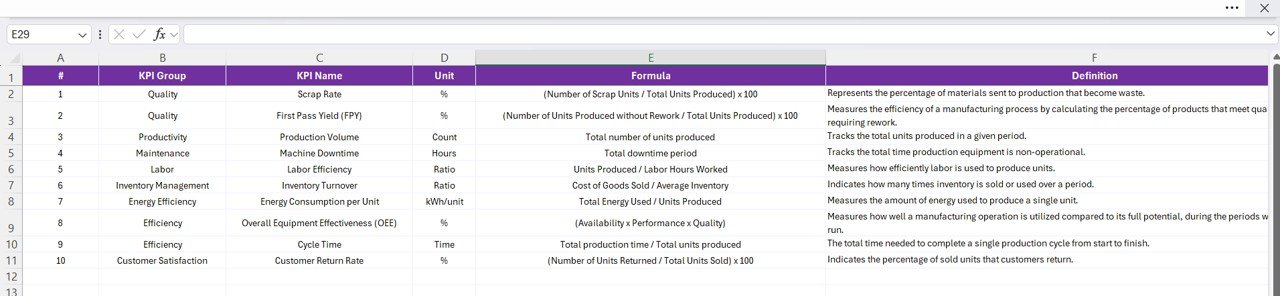
4. KPI Definition Sheet Tab
Provides the technical details of each KPI.
Colmns include:
- KPI Group
- KPI Name
- Unit
- Formula
- Definition
5. Color Settings Sheet Tab:
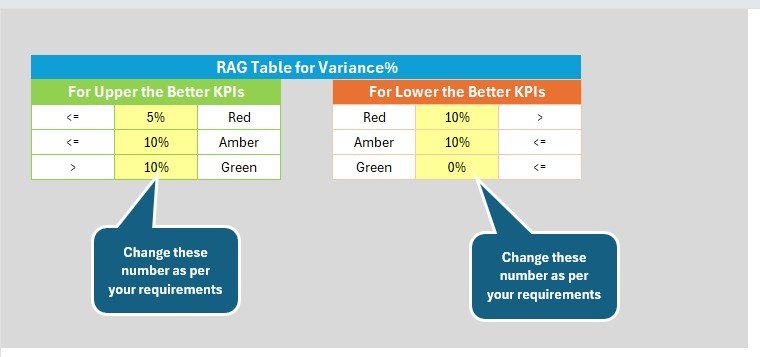
Click to Buy Manufacturing KPI Scorecard in Excel
Key Features of the Manufacturing KPI Scorecard
-
Interactive Dashboard: Quickly filter by month and switch between MTD/YTD.
-
Traffic-Light Indicators: Red, Yellow, and Green signals highlight KPI status.
-
Comparisons: Track Actual vs Target and PY to measure progress.
-
Automatic Updates: Change only the Input Data, and the dashboard refreshes.
-
Trend Analysis: Visualize KPI performance over time.
-
Standardized Definitions: KPI formulas documented for reference.
-
Excel-Based: No special software required; works on most systems.
Advantages of Manufacturing KPI Scorecard in Excel
Click to Buy Manufacturing KPI Scorecard in Excel
-
Cost-Effective: No need for expensive software or licenses.
-
Customizable: Add or remove KPIs as per business requirements.
-
User-Friendly: Simple Excel-based interface, easy for non-technical staff.
-
Quick Deployment: Ready-to-use template saves setup time.
-
Holistic View: Combines quality, productivity, efficiency, and customer satisfaction in one place.
-
Supports Continuous Improvement: Easily track areas where performance lags behind targets.
Opportunities for Improvement in Manufacturing KPI Scorecards
While Excel scorecards are powerful, there are areas where improvements can be made:
-
Automation: Link directly with ERP or MES systems for real-time updates.
-
Scalability: For larger enterprises, Excel may struggle with big datasets.
-
Data Security: Protect sensitive production data with password controls.
-
Collaboration: Sharing Excel files across teams can be improved using cloud versions (OneDrive, Google Drive).
-
Advanced Visualization: Integration with Power BI or Tableau can add deeper insights.
Best Practices for Using a Manufacturing KPI Scorecard
Click to Buy Manufacturing KPI Scorecard in Excel
-
Define KPIs Clearly: Ensure everyone understands formulas and definitions.
-
Set Realistic Targets: Avoid demotivating teams with unachievable goals.
-
Update Data Regularly: Keep input sheets updated weekly or monthly.
-
Review Trends, Not Just Numbers: Look for long-term improvements, not one-time spikes.
-
Focus on Action: Use scorecard results to drive decisions, not just reporting.
-
Use Conditional Formatting: Visual cues (green = good, red = poor) make reports actionable.
-
Train Staff: Ensure teams know how to read and act on KPI dashboards.
Conclusion
The Manufacturing KPI Scorecard in Excel is a simple yet powerful tool that gives manufacturing businesses complete visibility into their performance. By tracking the right KPIs, managers can spot inefficiencies, reduce costs, and improve both quality and output.
With structured data input, clear definitions, and a dynamic dashboard, this scorecard provides a foundation for continuous improvement and smarter decision-making.
Frequently Asked Questions (FAQ)
Click to Buy Manufacturing KPI Scorecard in Excel
1. What is the main purpose of a Manufacturing KPI Scorecard?
It helps manufacturers monitor key metrics like productivity, quality, and efficiency in one place for better decision-making.
2. How often should I update the KPI data?
Ideally, update data monthly for accuracy, though weekly updates can provide faster insights.
3. Can I add more KPIs to this scorecard?
Yes. You can expand the input and definition sheets to include more KPIs.
4. Is Excel suitable for large-scale manufacturing operations?
Excel works well for small and medium setups. For larger datasets, consider integrating with Power BI or ERP systems.
5. How do I know if my KPIs are effective?
A good KPI should be specific, measurable, achievable, relevant, and time-bound (SMART). If it drives action and aligns with business goals, it’s effective.
Visit our YouTube channel to learn step-by-step video tutorials
Click to Buy Manufacturing KPI Scorecard in Excel