Pharmacy workflow optimization is essential to ensure timely and efficient service. With multiple tasks, urgent cases, and varying staff responsibilities, identifying and addressing workflow bottlenecks can be a challenge. This is where the Pharmacy Workflow Bottleneck Analysis Dashboard in Excel comes into play. This ready-to-use Excel dashboard provides actionable insights to improve efficiency by pinpointing delays, workflow inefficiencies, and areas of improvement. In this article, we will walk you through the features of the dashboard and how it helps in analyzing bottlenecks within the pharmacy workflow.
What is the Pharmacy Workflow Bottleneck Analysis Dashboard?
The Pharmacy Workflow Bottleneck Analysis Dashboard is a tool designed to analyze the various stages in pharmacy operations to identify bottlenecks and inefficiencies. It provides insights into workflow speed, delays, and the performance of different stages of the pharmacy process. The dashboard includes several sheets that present detailed information on key performance indicators (KPIs) such as on-time stage percentages, repeat visit rates, stage durations, and delays.
This dashboard helps pharmacy managers and team leads make data-driven decisions to improve service delivery, optimize staff performance, and enhance customer satisfaction.
Key Features of the Pharmacy Workflow Bottleneck Analysis Dashboard
Click to buy Pharmacy Workflow Bottleneck Analysis Dashboard in Excel
The Pharmacy Workflow Bottleneck Analysis Dashboard contains multiple sheets, each dedicated to tracking a specific aspect of pharmacy workflow performance:
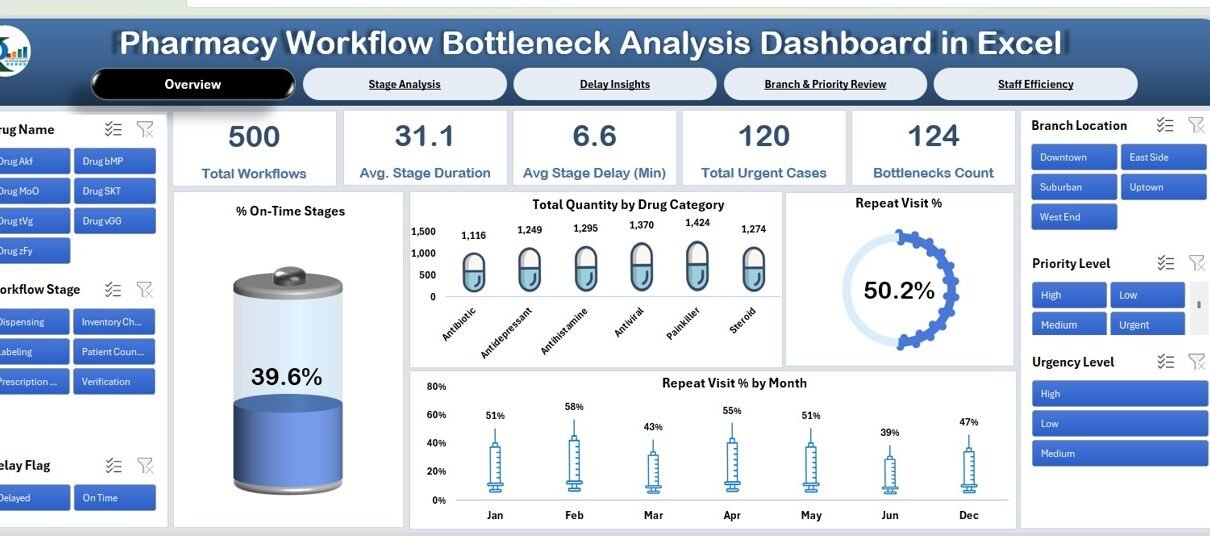
1. Overview Sheet Tab
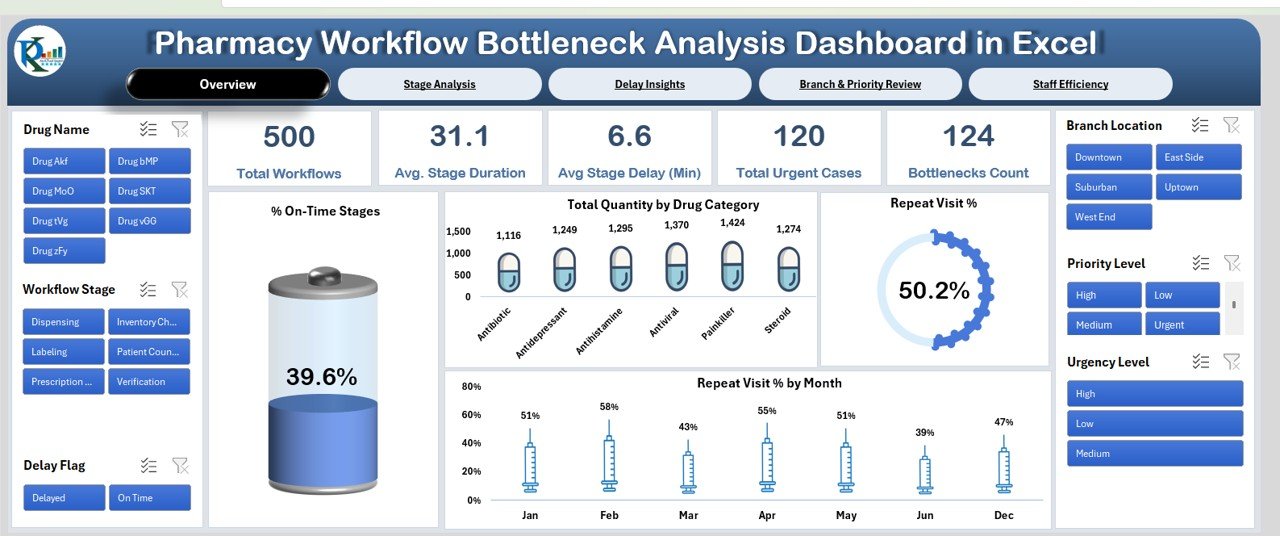
The Overview Sheet provides a high-level snapshot of the pharmacy’s overall workflow performance. It includes:
Cards:
- Total Workflows: Displays the total number of workflows completed during the selected time period.
- Avg. Stage Duration (Min): The average time taken at each stage of the workflow.
- Avg. Stage Delay (Min): The average delay in completing each workflow stage.
- Bottlenecks Count: The number of stages where bottlenecks or delays were observed.
- Total Urgent Cases: Displays the number of urgent cases handled during the time period.
Charts:
- % On-Time Stages: Displays the percentage of stages completed on time.
- Total Quantity by Drug Category: A chart that shows the quantity of drugs processed, categorized by type.
- Repeat Visit %: Shows the percentage of patients who made repeat visits.
- Repeat Visit % by Month: A trend chart displaying repeat visits over time.
Click to buy Pharmacy Workflow Bottleneck Analysis Dashboard in Excel
2. Stage Analysis Sheet Tab
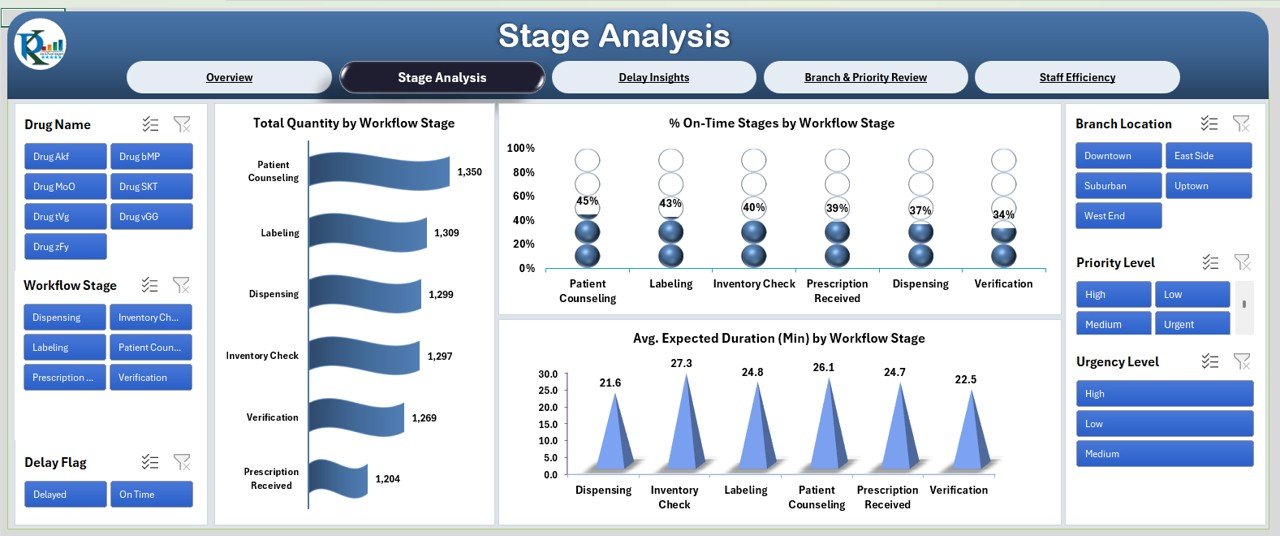
The Stage Analysis Sheet provides insights into the performance of individual workflow stages, helping to identify areas that need attention. Key charts include:
-
Total Quantity by Workflow Stage: Shows the total number of workflows at each stage of the process.
-
% On-Time Stages by Workflow Stage: Displays the percentage of workflows that were completed on time at each stage.
-
Avg. Expected Duration (Min) by Workflow Stage: Compares the expected and actual time taken for each stage.
Click to buy Pharmacy Workflow Bottleneck Analysis Dashboard in Excel
3. Delay Insights Sheet Tab
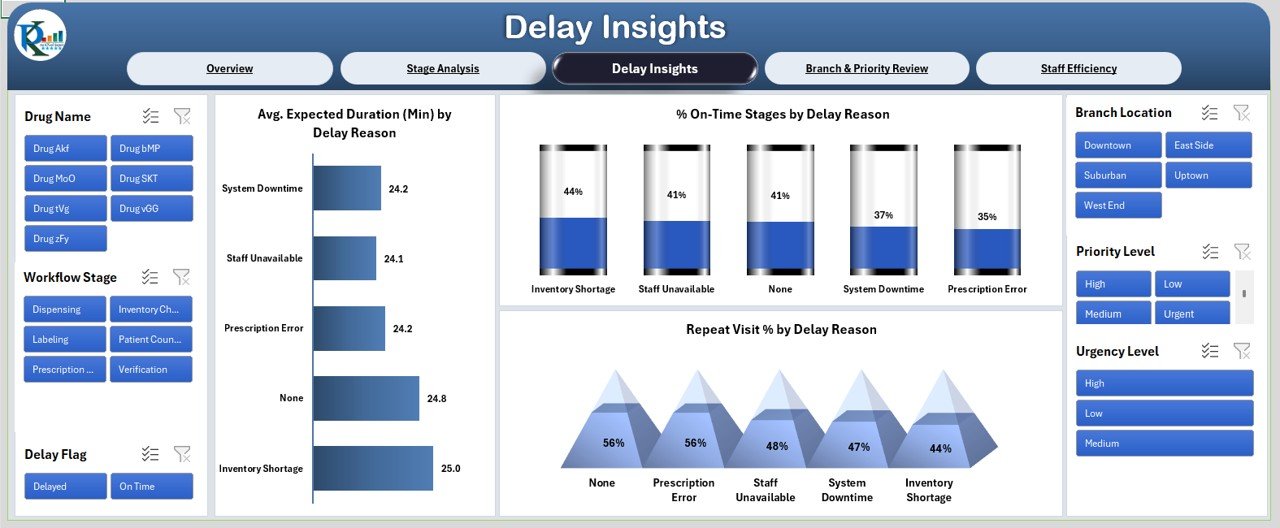
The Delay Insights Sheet focuses on analyzing delays and their causes. It includes the following charts:
-
Avg. Expected Duration (Min) by Delay Reason: Displays the average expected duration for workflows delayed by specific reasons.
-
% On-Time Stages by Delay Reason: Shows the percentage of stages that were completed on time, categorized by delay reason.
-
Repeat Visit % by Delay Reason: Displays the percentage of repeat visits caused by specific delay reasons.
4. Branch & Priority Review Sheet Tab
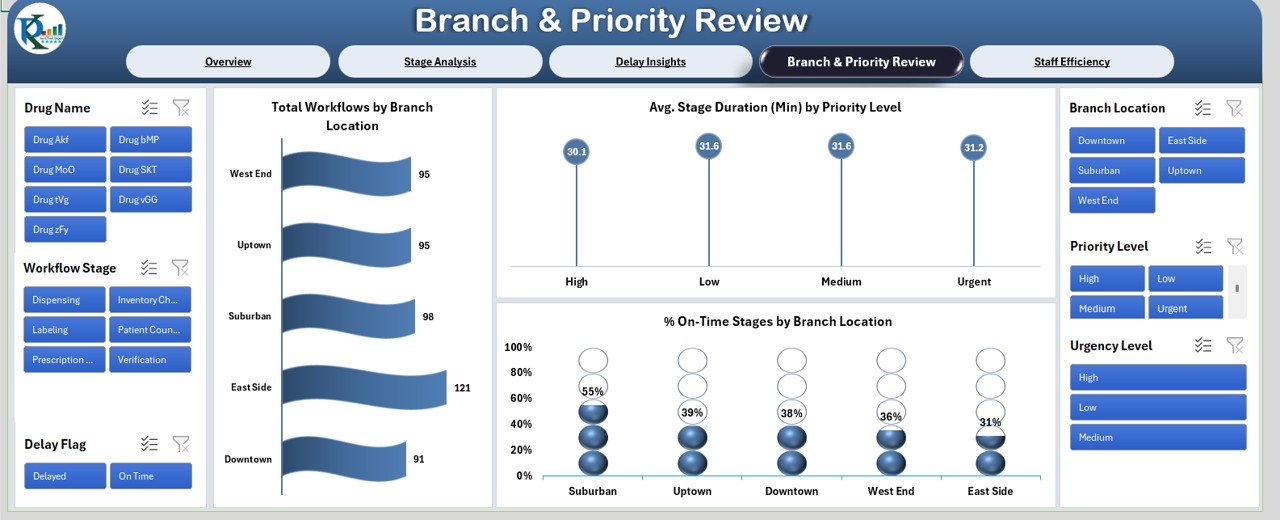
The Branch & Priority Review Sheet provides insights into the workflow performance by branch and priority level. Key charts include:
-
Total Workflows by Branch Location: Displays the total number of workflows processed at each branch.
-
Avg. Stage Duration (Min) by Priority Level: Shows the average time spent at each stage, based on the priority level of the case.
-
% On-Time Stages by Branch Location: Displays the percentage of workflows completed on time at each branch.
Click to buy Pharmacy Workflow Bottleneck Analysis Dashboard in Excel
5. Staff Efficiency Sheet Tab
The Staff Efficiency Sheet helps evaluate the performance of individual staff members and assess their efficiency in handling workflows. Charts include:
-
Total Workflows by Urgency Level: Displays the number of workflows by urgency level (e.g., urgent, normal).
-
% On-Time Stages by Staff Member: Shows the percentage of workflows completed on time, broken down by staff member.
-
Avg. Stage Duration (Min) by Staff Member: Displays the average time taken at each stage by individual staff members.

Click to buy Pharmacy Workflow Bottleneck Analysis Dashboard in Excel
6. Data Sheet Tab
The Data Sheet is where all the input data is entered, such as the dates, workflow stages, delays, and staff information. This is the foundation for the entire dashboard, as it is linked to the various charts and KPIs across the other sheets.
Benefits of Using the Pharmacy Workflow Bottleneck Analysis Dashboard
-
Improved Workflow Efficiency: By identifying bottlenecks and delays, pharmacy managers can take corrective actions to optimize the workflow process.
-
Better Resource Allocation: The dashboard helps identify high-performing staff members and branches, enabling better resource allocation.
-
Enhanced Customer Service: By tracking urgent cases and repeat visits, pharmacies can ensure that critical cases are handled promptly, improving overall customer satisfaction.
-
Data-Driven Decision Making: With real-time data and insights, pharmacy managers can make informed decisions to streamline operations.
-
Time-Saving: The dashboard automates much of the analysis, saving time spent on manual tracking and reporting.
Best Practices for Using the Pharmacy Workflow Bottleneck Analysis Dashboard
Click to buy Pharmacy Workflow Bottleneck Analysis Dashboard in Excel
To get the most out of this Pharmacy Workflow Bottleneck Analysis Dashboard, follow these best practices:
-
Regularly Update Data: Ensure that the data in the Data Sheet is updated regularly to reflect the most current information.
-
Monitor KPIs Continuously: Keep track of KPIs like Repeat Visit % and Bottlenecks Count to stay on top of workflow performance.
-
Address Identified Bottlenecks: When bottlenecks are detected, investigate the cause and implement corrective measures to reduce delays.
-
Optimize Staffing: Use the Staff Efficiency Sheet to identify areas where staffing adjustments may be needed.
-
Use Data for Training: If certain staff members are consistently underperforming, use the insights to provide targeted training.
Conclusion
The Pharmacy Workflow Bottleneck Analysis Dashboard in Excel is a powerful tool for pharmacy managers and team leads to optimize pharmacy operations. By identifying bottlenecks, tracking performance by branch and staff member, and understanding the reasons behind delays, the dashboard helps pharmacies improve efficiency, reduce wait times, and enhance customer service. With its easy-to-use interface and real-time insights, this dashboard is an essential asset for any pharmacy aiming to streamline workflows and boost performance.
Frequently Asked Questions (FAQs)
Click to buy Pharmacy Workflow Bottleneck Analysis Dashboard in Excel
1. What is a pharmacy workflow bottleneck?
A pharmacy workflow bottleneck refers to any point in the pharmacy process where tasks are delayed, causing inefficiencies and longer wait times for patients.
2. How can the dashboard help in reducing delays?
By identifying bottlenecks and understanding the causes of delays, the dashboard enables pharmacy managers to take corrective actions, such as improving staffing or adjusting processes.
3. Can the dashboard track the performance of individual staff members?
Yes, the Staff Efficiency Sheet tab tracks performance metrics like % On-Time Stages and Avg. Stage Duration for each staff member.
4. How often should I update the data in the dashboard?
It is recommended to update the data regularly, at least weekly, to ensure that the insights are accurate and up to date.
5. Is the dashboard customizable?
Yes, the dashboard is customizable. You can modify charts, add new metrics, or adjust the data entry structure to suit your specific needs.
Visit our YouTube channel to learn step-by-step video tutorials
Click to buy Pharmacy Workflow Bottleneck Analysis Dashboard in Excel