Managing procurement in port operations is never simple. Ports handle large volumes of purchasing related to fuel, equipment, spare parts, maintenance services, dredging materials, IT infrastructure, safety systems, and many other critical items. Therefore, procurement teams must track costs, supplier performance, timelines, and compliance continuously.
However, when procurement data remains scattered across multiple Excel files, emails, and ERP exports, visibility drops quickly. As a result, decision-making becomes slow, inefficiencies increase, and cost overruns appear more often.
That is exactly why a Port Procurement KPI Dashboard in Excel becomes a powerful, practical, and business-ready solution.
In this in-depth article, you will learn what a Port Procurement KPI Dashboard in Excel is, why ports need it, how it works, its complete worksheet structure, key KPIs, advantages, best practices, and frequently asked questions. Moreover, this guide uses simple language, clear explanations, and real-world port procurement logic so you can apply it confidently in real operations.
Click to buy Port Procurement KPI Dashboard in Excel
What Is a Port Procurement KPI Dashboard in Excel?
A Port Procurement KPI Dashboard in Excel is a centralized performance monitoring tool designed to track, analyze, and visualize procurement-related KPIs for port operations.
Instead of reviewing raw procurement data manually, this dashboard converts numbers into meaningful insights. Consequently, procurement managers, finance teams, and port authorities can monitor performance at a glance.
Moreover, because it is built in Excel, this dashboard remains easy to use, flexible, and cost-effective. You do not need advanced BI tools, technical coding skills, or expensive software licenses. Instead, you can start using it immediately.
Why Do Ports Need a Procurement KPI Dashboard?
Ports operate in complex environments with high operational pressure. Therefore, procurement decisions directly impact operational efficiency, safety, and profitability.
Without a structured KPI dashboard, procurement teams often face several challenges:
- Lack of visibility into monthly and yearly procurement performance
- Difficulty comparing actual costs with targets
- Limited insight into supplier efficiency and delays
- Manual reporting that consumes time and resources
- Inconsistent KPI definitions across departments
However, when you use a Port Procurement KPI Dashboard in Excel, you solve these problems effectively. As a result, teams gain clarity, control, and confidence in procurement decisions.
How Does a Port Procurement KPI Dashboard in Excel Work?
The dashboard works by combining structured input sheets, predefined KPI formulas, and dynamic visuals.
First, users enter actual procurement numbers, targets, and previous year data. Then, Excel automatically calculates MTD, YTD, variances, and trends. Finally, the dashboard presents everything visually using tables, indicators, and charts.
Because of this flow, users spend less time preparing reports and more time analyzing insights.
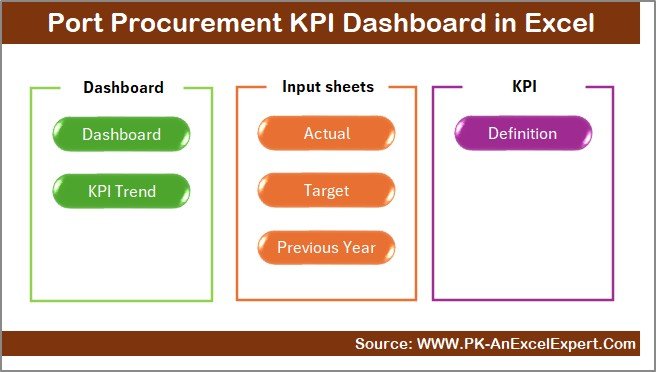
Complete Worksheet Structure of the Port Procurement KPI Dashboard in Excel
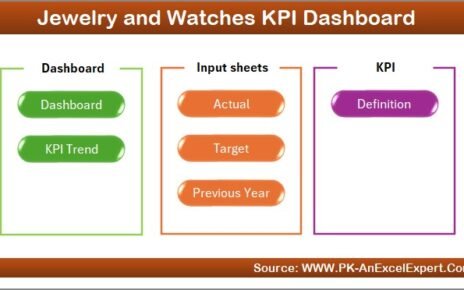
This Port Procurement KPI Dashboard in Excel contains 7 well-structured worksheets, each serving a specific purpose. Together, these sheets create a seamless reporting and analysis experience.
Summary Page – How Does the Summary Page Improve Navigation?
The Summary Page works as an index sheet for the entire dashboard.
Here, you get 6 navigation buttons that allow you to jump directly to different sheets. As a result, users do not waste time scrolling through tabs.
This page improves usability, especially for senior management who want quick access to insights.
Click to buy Port Procurement KPI Dashboard in Excel
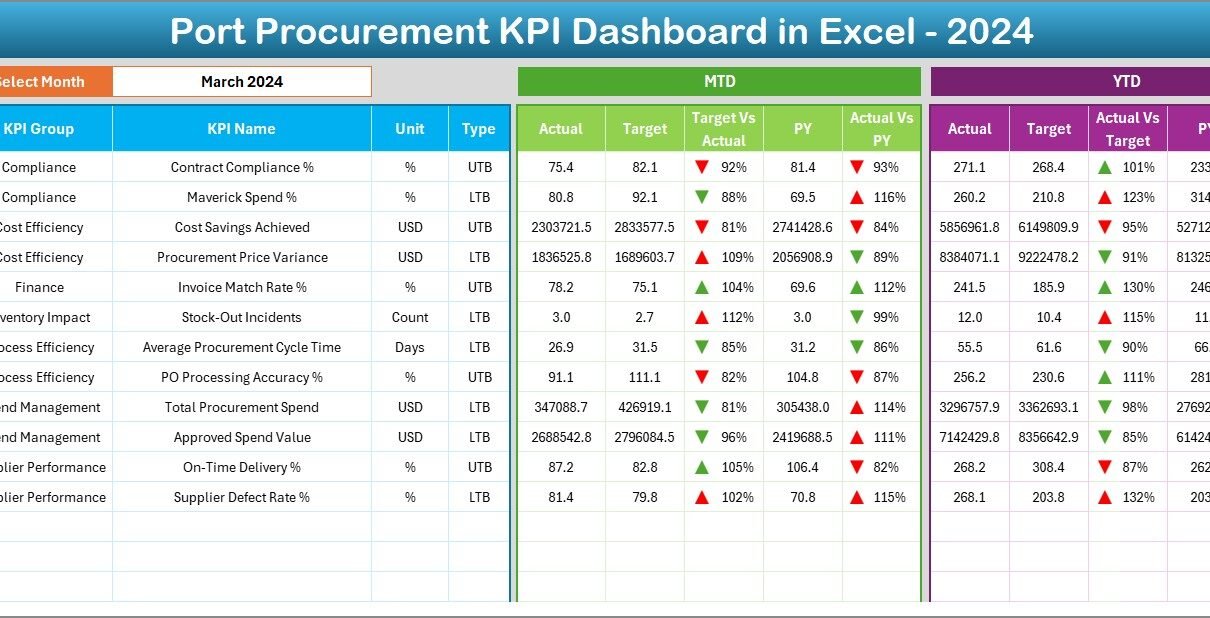
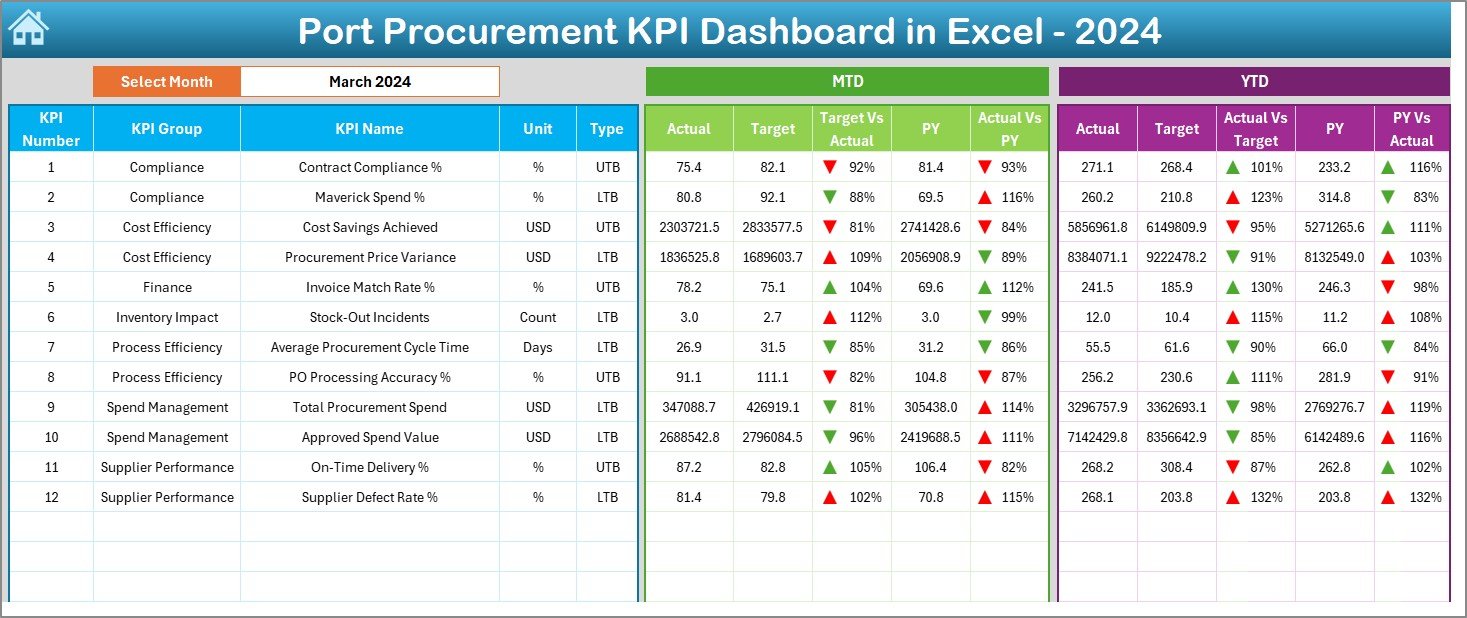
Dashboard Sheet – How Does the Main Dashboard Present Procurement KPIs?
The Dashboard Sheet is the heart of the entire solution.
On this sheet:
- You can select the Month from a drop-down at cell D3
- All KPI numbers update instantly based on the selected month
- You can view MTD Actual, Target, and Previous Year values
- You can also see YTD Actual, Target, and Previous Year values
- The dashboard displays Target vs Actual and Previous Year vs Actual comparisons
- Conditional formatting arrows clearly show performance direction
Because of this structure, users can quickly identify whether procurement performance improves or declines.
Click to buy Port Procurement KPI Dashboard in Excel
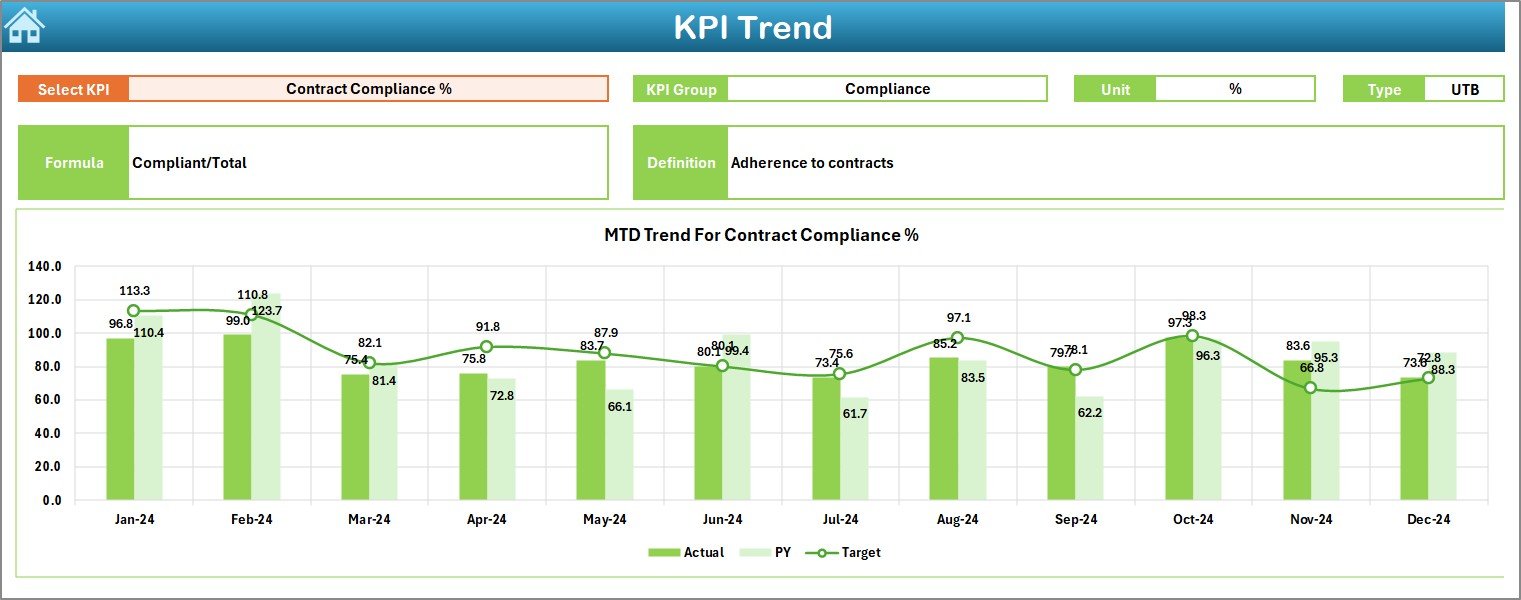
Trend Sheet – How Can You Analyze KPI Trends Over Time?
The Trend Sheet focuses on deep KPI analysis.
On this sheet:
- You select the KPI Name from a drop-down at cell C3
- The dashboard displays:
KPI Group
KPI Unit
KPI Type (Lower the Better or Upper the Better)
KPI Formula
KPI Definition
Additionally, this sheet shows MTD and YTD trend charts for:
- Actual values
- Target values
- Previous Year values
Therefore, users can track performance patterns over time instead of viewing isolated numbers.
Click to buy Port Procurement KPI Dashboard in Excel
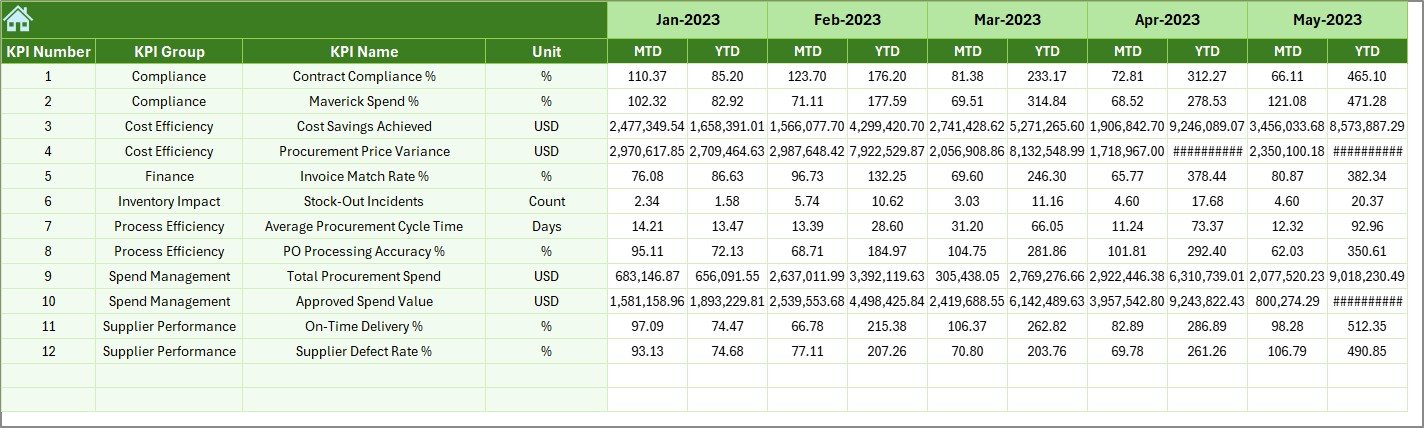
Actual Numbers Input Sheet – Where Do You Enter Actual Procurement Data?
The Actual Numbers Input Sheet captures real procurement performance.
Here:
- You enter MTD and YTD actual numbers for each KPI
- You can change the reporting month using cell E1
- You simply input the first month of the year in cell E1
- Excel automatically adjusts calculations for all months
This design ensures flexibility while maintaining accuracy.

Click to buy Port Procurement KPI Dashboard in Excel
Target Sheet – How Do You Set Procurement Targets?
The Target Sheet stores planned procurement targets.
On this sheet:
- You enter MTD and YTD target values for each KPI
- Targets remain consistent across dashboard calculations
- Teams can compare actual performance against planned goals
As a result, procurement teams can monitor whether they stay on track throughout the year.

Click to buy Port Procurement KPI Dashboard in Excel
Previous Year Number Sheet – Why Is Historical Comparison Important?
The Previous Year Number Sheet captures historical data.
Here:
- You enter procurement numbers for the previous year
- The structure matches the current year data
- Excel uses this data for year-over-year comparisons
Because of this, decision-makers can easily measure improvement or decline.
Click to buy Port Procurement KPI Dashboard in Excel
KPI Definition Sheet – Why Is KPI Standardization Critical?
The KPI Definition Sheet ensures clarity and consistency.
On this sheet, you define:
- KPI Name
- KPI Group
- Unit of Measurement
- Formula
- KPI Definition
This approach ensures that everyone interprets KPIs the same way. Consequently, reporting becomes accurate and aligned across departments.

Click to buy Port Procurement KPI Dashboard in Excel
What Are the Key KPIs Tracked in a Port Procurement KPI Dashboard?
Although KPIs vary by port, most procurement dashboards include:
- Total Procurement Cost
- Average Procurement Cycle Time
- Supplier On-Time Delivery %
- Cost Variance %
- Purchase Order Compliance %
- Emergency Purchase Ratio
- Vendor Concentration Ratio
- Contract Utilization %
These KPIs provide a balanced view of cost, efficiency, compliance, and risk.
Advantages of Port Procurement KPI Dashboard in Excel
Why Should Ports Use This Dashboard?
Using a Port Procurement KPI Dashboard in Excel delivers multiple benefits.
- Centralized Visibility: View all procurement KPIs in one place
- Faster Decision-Making: Identify issues quickly using visual indicators
- Improved Cost Control: Track cost variances proactively
- Better Supplier Management: Monitor vendor performance consistently
- Historical Comparison: Analyze trends using previous year data
- User-Friendly Design: Easy navigation and clear layout
- No Additional Software Cost: Works entirely in Excel
Because of these advantages, ports can improve procurement governance significantly.
Who Can Use a Port Procurement KPI Dashboard in Excel?
This dashboard suits multiple roles, including:
- Port Procurement Managers
- Finance and Cost Control Teams
- Operations Managers
- Vendor Management Teams
- Senior Port Authorities
- Internal Audit Teams
Each role benefits from improved visibility and data-driven insights.
Best Practices for the Port Procurement KPI Dashboard in Excel
How Can You Use This Dashboard Effectively?
To get the best results, follow these best practices:
- Keep KPI definitions simple and standardized
- Update actual numbers regularly and consistently
- Review trends monthly instead of only annually
- Set realistic and achievable targets
- Use historical data to improve future planning
- Train users on KPI interpretation
- Avoid overcrowding the dashboard with unnecessary KPIs
When you follow these practices, the dashboard delivers maximum value.
How Does This Dashboard Improve Procurement Governance?
A structured KPI dashboard enforces accountability.
Because every KPI has a clear definition, formula, and target, procurement teams take ownership of results. Moreover, leadership gains confidence in reported numbers.
As a result, procurement governance becomes transparent and data-driven.
How Does Excel Make This Dashboard More Flexible?
Excel allows customization without complexity.
You can add new KPIs, adjust formulas, or modify visuals easily. Moreover, Excel integrates smoothly with ERP exports and CSV files.
Therefore, this dashboard grows with your port’s procurement needs.
Conclusion: Why Is a Port Procurement KPI Dashboard in Excel a Smart Investment?
A Port Procurement KPI Dashboard in Excel transforms procurement reporting from manual, time-consuming tasks into a structured, insightful process.
It centralizes data, highlights performance gaps, improves accountability, and supports informed decision-making. Most importantly, it achieves all this without expensive tools or complex systems.
If your port aims to improve procurement efficiency, cost control, and transparency, this dashboard becomes an essential solution.
Frequently Asked Questions (FAQs)
What is a Port Procurement KPI Dashboard in Excel used for?
It tracks, analyzes, and visualizes procurement KPIs to support better purchasing decisions in port operations.
Do I need advanced Excel skills to use this dashboard?
No, basic Excel knowledge is enough to operate and update the dashboard.
Can I customize KPIs in the dashboard?
Yes, you can easily add, modify, or remove KPIs using the KPI Definition Sheet.
How often should I update the dashboard?
You should update it monthly for accurate MTD and YTD analysis.
Can this dashboard handle multiple years of data?
Yes, it supports current year and previous year comparisons effectively.
Is this dashboard suitable for small and large ports?
Yes, the structure works well for ports of all sizes.
Does the dashboard support performance trend analysis?
Yes, the Trend Sheet provides detailed MTD and YTD trend charts.
Can this dashboard integrate with ERP data?
Yes, you can import ERP data into Excel and link it easily.
Does this dashboard help in supplier performance evaluation?
Yes, it highlights supplier-related KPIs and delivery performance.
Why choose Excel instead of BI tools?
Excel offers flexibility, lower cost, faster deployment, and ease of use.
Visit our YouTube channel to learn step-by-step video tutorials
Watch the step-by-step video tutorial:
Click to buy Port Procurement KPI Dashboard in Excel