Managing purchasing activities in port operations demands accuracy, transparency, and speed. Ports handle high-value procurement related to fuel, equipment, spare parts, maintenance services, dredging materials, IT systems, and infrastructure projects. Therefore, procurement teams must track costs, monitor supplier performance, control budgets, and ensure compliance every single month.
However, when purchasing data stays scattered across spreadsheets, emails, and manual reports, visibility drops quickly. As a result, decision-making slows down, cost overruns increase, and risks rise.
That is exactly why a Port Purchasing KPI Dashboard in Excel becomes a powerful and business-ready solution.
In this detailed article, you will learn what a Port Purchasing KPI Dashboard in Excel is, why ports need it, how it works, its worksheet structure, KPIs, advantages, best practices, and FAQs. Moreover, this guide uses simple language, strong transitions, and practical port-industry logic so you can apply it confidently in real-world environments.
Click to buy Port Purchasing KPI Dashboard in Excel
What Is a Port Purchasing KPI Dashboard in Excel?
A Port Purchasing KPI Dashboard in Excel is a centralized performance monitoring tool designed to track, analyze, and visualize procurement-related KPIs for port operations.
Instead of reviewing raw purchasing data manually, this dashboard converts numbers into meaningful insights. Consequently, procurement managers, finance teams, and port authorities gain instant visibility into purchasing performance.
Because the dashboard runs entirely in Excel, teams can deploy it quickly without expensive BI tools or complex setups. Moreover, Excel allows flexibility, customization, and easy adoption across departments.
Why Do Ports Need a Purchasing KPI Dashboard?
Ports operate in a high-cost, high-risk environment. Therefore, procurement inefficiencies directly impact profitability, timelines, and compliance.
Here is why ports need a structured purchasing KPI dashboard:
- Procurement costs form a major portion of port operating expenses
- Multiple vendors and contracts increase tracking complexity
- Manual reports delay corrective actions
- Budget overruns often go unnoticed until month-end
- Leadership needs quick, reliable insights
Because of these challenges, ports require a dashboard that delivers real-time performance clarity.
How Does a Port Purchasing KPI Dashboard in Excel Work?
The dashboard works by connecting structured KPI definitions with actual, target, and previous-year numbers. Then, Excel formulas, pivot tables, and charts convert this data into dynamic visuals.
As soon as users select a month, the entire dashboard updates automatically. Consequently, teams track trends, variances, and performance gaps instantly.
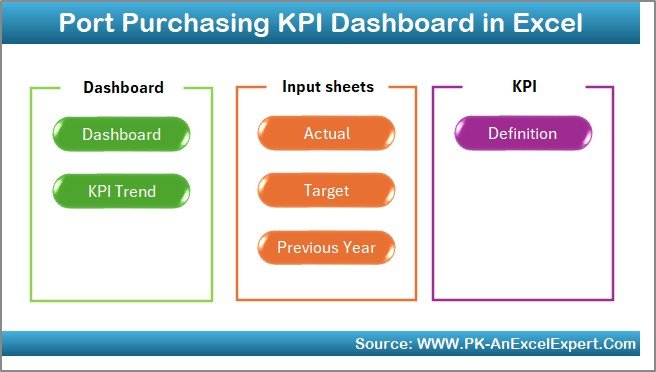
What Is the Overall Structure of the Port Purchasing KPI Dashboard?
This Port Purchasing KPI Dashboard in Excel follows a professional and scalable structure. In total, it contains 7 well-designed worksheets, each serving a specific purpose.
Let us explore each sheet in detail.
Summary Page: How Does the Dashboard Navigation Work?
The Summary Page acts as the index sheet of the dashboard.
Key Features of the Summary Page
- Clean and simple layout
- Six navigation buttons
- Quick access to all major worksheets
- User-friendly design for non-technical users
Because of this design, users can move across the dashboard effortlessly. Moreover, it improves usability and adoption across departments.
Click to buy Port Purchasing KPI Dashboard in Excel
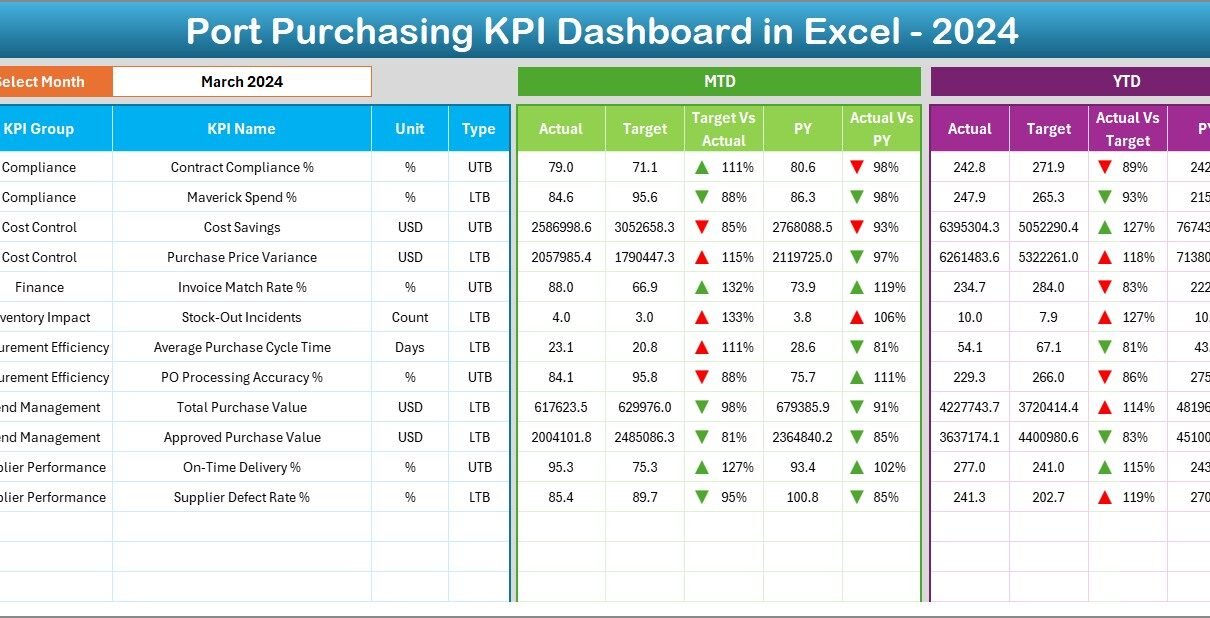
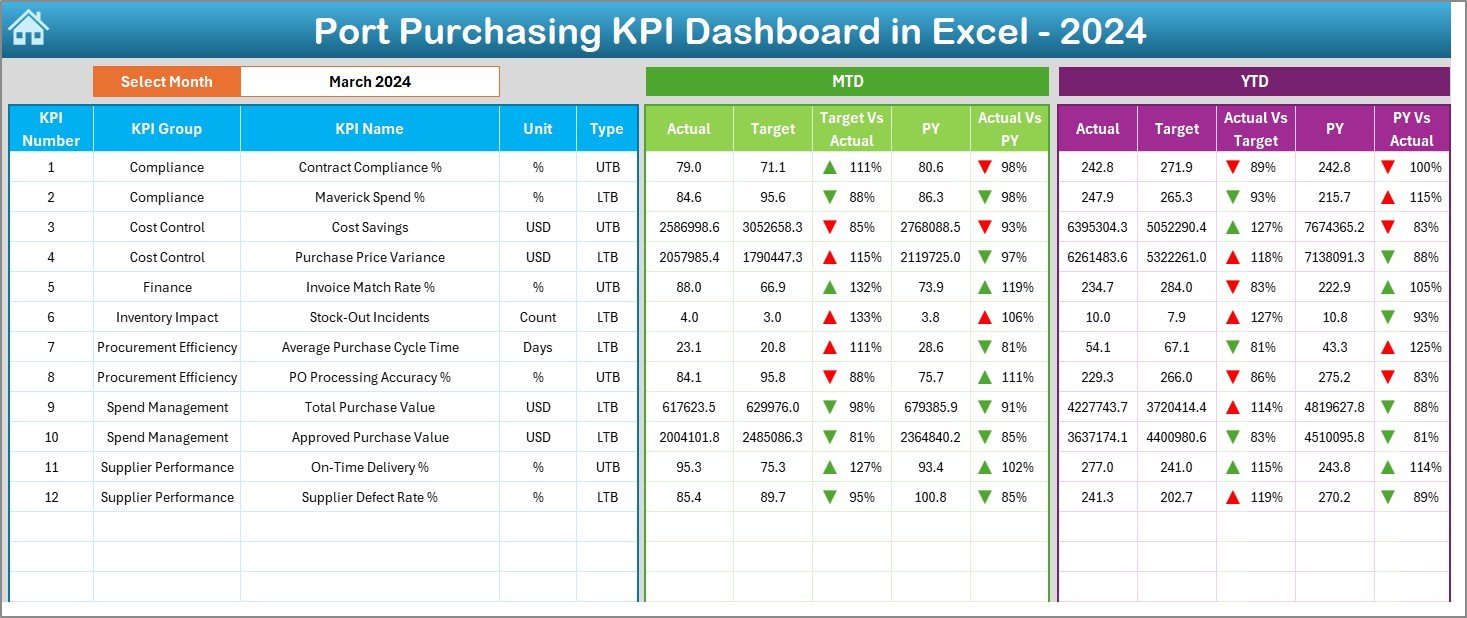
Dashboard Sheet: What KPIs Does the Main Dashboard Show?
The Dashboard Sheet serves as the heart of the solution. It displays all key purchasing KPIs in one place.
Month Selection Logic
- Month selection available in cell D3
- Users choose the reporting month from a drop-down
- Entire dashboard updates instantly
KPIs Displayed on the Dashboard
The dashboard shows both MTD (Month-to-Date) and YTD (Year-to-Date) metrics:
- Actual values
- Target values
- Previous Year values
- Target vs Actual variance
- Previous Year vs Actual variance
Visual Indicators
- Conditional formatting arrows (up/down)
- Easy identification of overperformance or underperformance
- Clear color-based signals for faster decisions
Because of this layout, procurement teams understand performance at a glance.
Click to buy Port Purchasing KPI Dashboard in Excel
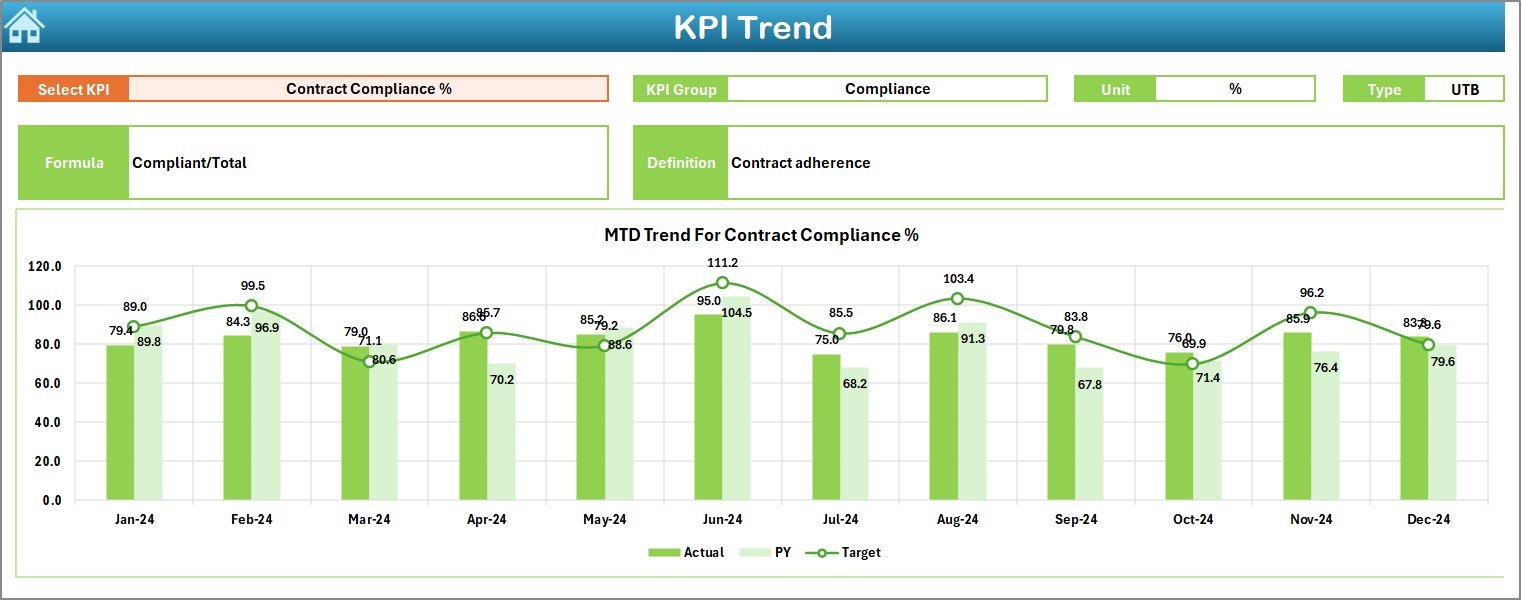
Trend Sheet: How Can You Analyze KPI Trends?
The Trend Sheet focuses on detailed KPI-level analysis.
KPI Selection
- KPI selection available in cell C3
- Users choose a specific KPI to analyze
KPI Information Displayed
Once selected, the dashboard shows:
- KPI Group
- Unit of KPI
- KPI Type (Upper the Better or Lower the Better)
- KPI Formula
- KPI Definition
Trend Charts
- MTD trend chart for Actual, Target, and PY
- YTD trend chart for Actual, Target, and PY
- Clear comparison across months
Because of this sheet, users move from summary insights to deep KPI analysis easily.
Click to buy Port Purchasing KPI Dashboard in Excel
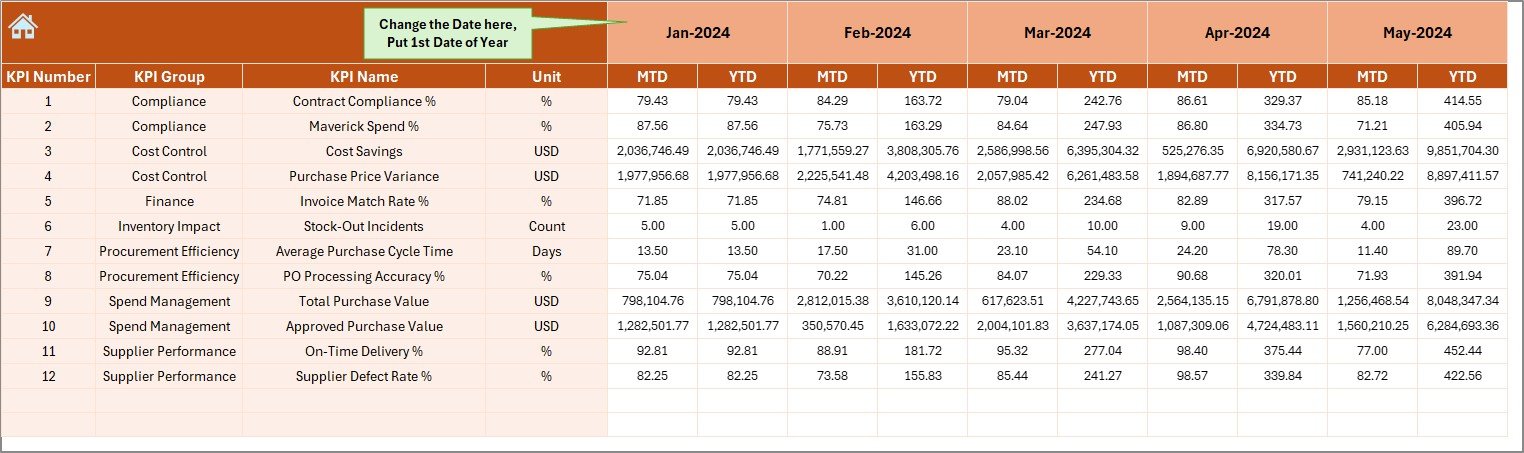
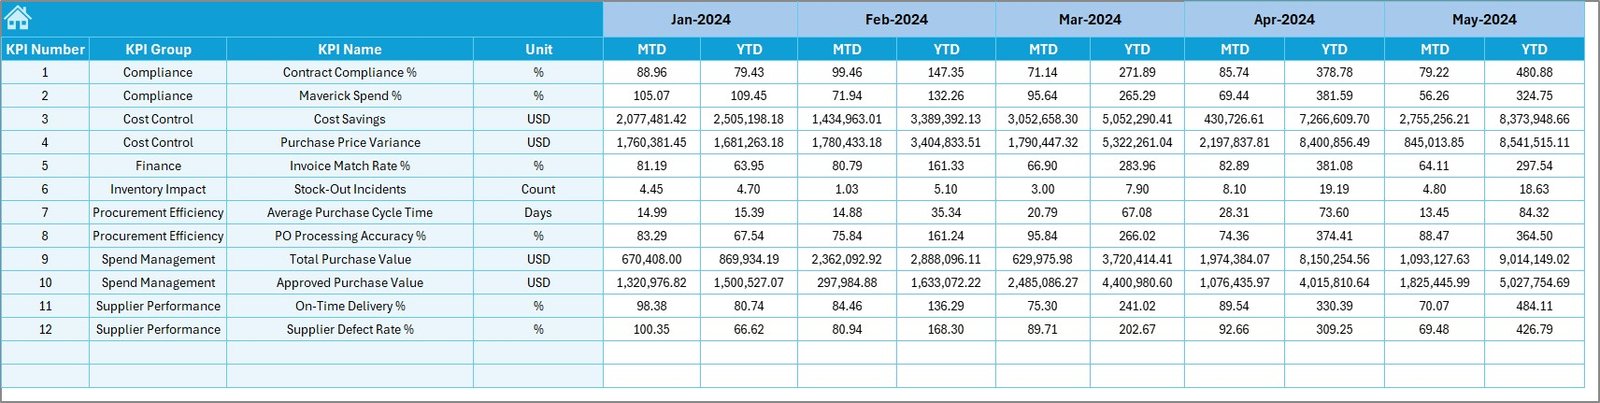
Actual Numbers Input Sheet: Where Do Users Enter Actual Data?
The Actual Numbers Input Sheet allows users to enter real purchasing performance numbers.
How Data Entry Works
- Month selection available in cell E1
- Users enter the first month of the year in E1
- MTD and YTD actual values entered for each KPI
Benefits of This Sheet
- Centralized data entry
- Reduced data errors
- Consistent monthly updates
As a result, data accuracy improves significantly.
Click to buy Port Purchasing KPI Dashboard in Excel
Target Sheet: How Are Purchasing Targets Managed?
The Target Sheet stores planned targets for each KPI.
Target Data Entry
- Users enter MTD target values
- Users enter YTD target values
- Targets align with annual procurement plans
Because targets remain separate from actual data, analysis stays clean and structured.
Click to buy Port Purchasing KPI Dashboard in Excel
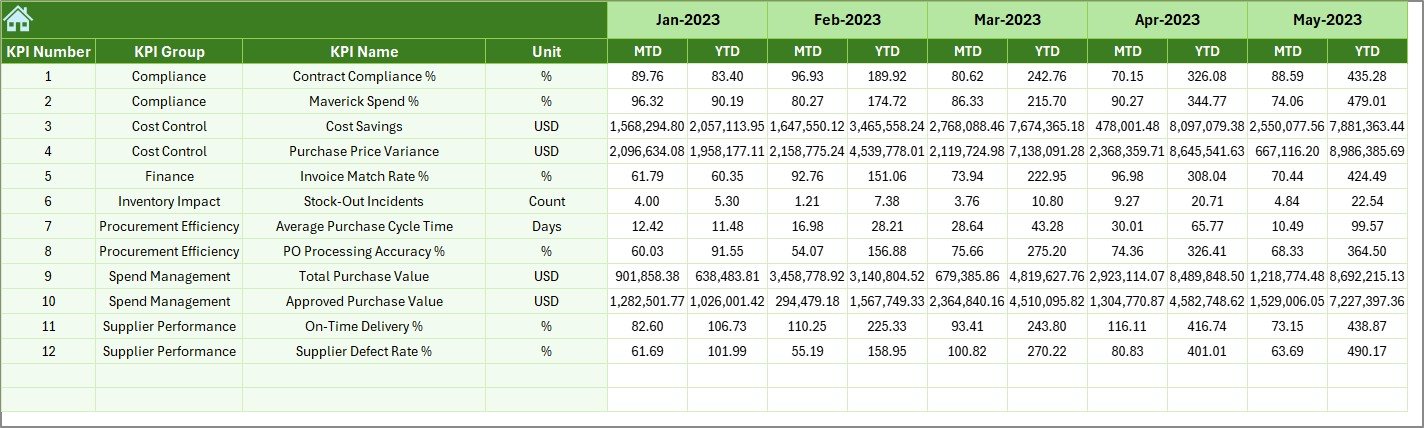
Previous Year Number Sheet: Why Is Historical Comparison Important?
The Previous Year Number Sheet captures historical KPI values.
Purpose of This Sheet
- Enables year-over-year comparison
- Helps identify performance improvement or decline
- Supports strategic procurement planning
Users enter previous-year MTD and YTD values exactly like current-year data.
Click to buy Port Purchasing KPI Dashboard in Excel
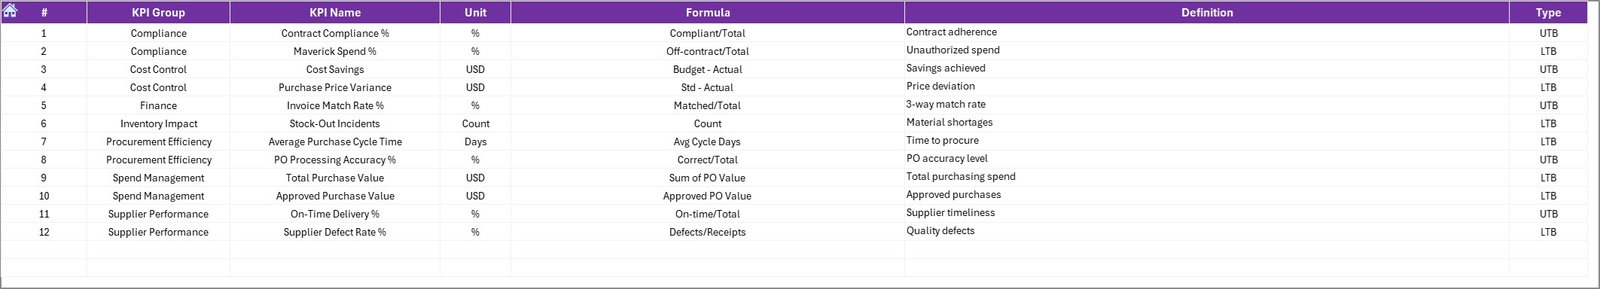
KPI Definition Sheet: How Are KPIs Standardized?
The KPI Definition Sheet acts as the backbone of the dashboard.
Information Stored
- KPI Name
- KPI Group
- Unit
- Formula
- KPI Definition
Because KPIs stay standardized, teams avoid confusion and maintain consistent reporting.
Click to buy Port Purchasing KPI Dashboard in Excel
What Are Common KPIs in a Port Purchasing Dashboard?
A Port Purchasing KPI Dashboard typically includes KPIs such as:
- Total Purchasing Cost
- Cost Variance
- Purchase Order Cycle Time
- Vendor On-Time Delivery Rate
- Contract Compliance Rate
- Emergency Purchase Ratio
- Savings Achieved
- Budget Utilization Percentage
These KPIs help ports control costs and improve supplier performance.
Advantages of Port Purchasing KPI Dashboard in Excel
- Why Does Centralized Visibility Matter?
A single dashboard eliminates data silos. Therefore, teams access accurate information instantly.
- How Does It Improve Cost Control?
Real-time variance analysis helps teams identify overspending early.
- Why Is Excel a Smart Choice?
Excel requires no additional software investment and supports customization.
- How Does It Support Faster Decisions?
Visual indicators and trends highlight issues immediately.
- Why Does It Improve Accountability?
Clear KPIs assign ownership and responsibility across teams.
How Does This Dashboard Support Strategic Port Management?
Because procurement impacts every port function, this dashboard supports:
- Budget planning
- Vendor negotiations
- Risk management
- Compliance audits
- Long-term cost optimization
As a result, leadership gains confidence in procurement decisions.
Best Practices for Port Purchasing KPI Dashboard in Excel
- Define KPIs Clearly
Always maintain clear definitions and formulas.
- Update Data Monthly
Regular updates ensure accuracy and trust.
- Review Variances Actively
Do not ignore negative trends.
- Train Users Properly
Ensure teams understand how to read KPIs.
- Maintain Data Consistency
Follow the same data entry structure every month.
How Can Ports Customize This Dashboard Further?
Ports can easily extend this dashboard by adding:
- Vendor-wise analysis sheets
- Category-wise procurement views
- Risk-based KPIs
- Contract-linked purchasing metrics
Excel flexibility makes customization simple and cost-effective.
Conclusion: Why Is a Port Purchasing KPI Dashboard in Excel a Must-Have Tool?
A Port Purchasing KPI Dashboard in Excel transforms procurement management from reactive to proactive. Instead of struggling with scattered data, teams gain structured insights, real-time visibility, and performance clarity.
Because it combines simplicity, flexibility, and powerful analytics, this dashboard becomes an essential tool for modern port operations.
If ports aim to control costs, improve vendor performance, and strengthen decision-making, this dashboard delivers exceptional value.
Frequently Asked Questions (FAQs)
What Is the Main Purpose of a Port Purchasing KPI Dashboard in Excel?
The main purpose is to monitor, analyze, and improve purchasing performance using structured KPIs.
Who Can Use This Dashboard?
Procurement managers, finance teams, operations managers, and port leadership can use it effectively.
Does This Dashboard Require Advanced Excel Skills?
No. Basic Excel knowledge is enough to operate and update the dashboard.
Can This Dashboard Handle Multiple Years of Data?
Yes. Users can easily extend it for multiple years.
Can KPIs Be Customized?
Yes. The KPI Definition Sheet allows full customization.
How Often Should Data Be Updated?
Monthly updates deliver the best results.
Is This Dashboard Suitable for Small and Large Ports?
Yes. The structure scales easily for ports of all sizes.
Does This Dashboard Replace ERP Systems?
No. It complements ERP systems by improving visibility and reporting.
Can This Dashboard Support Audits?
Yes. Standardized KPIs and historical data support audits effectively.
Why Choose Excel Over BI Tools?
Excel offers faster deployment, lower cost, and higher flexibility.
Visit our YouTube channel to learn step-by-step video tutorials
Click to buy Port Purchasing KPI Dashboard in Excel
Watch the step-by-step video tutorial: