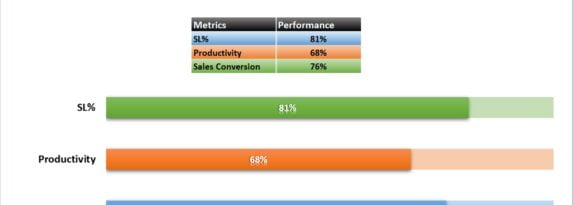
Progress Bar Chart in Excel Progress Bar Chart in Excel is very useful chart to show the completion% or other % metrics. In this example, we have displayed the Service Level Value, Productivity and Sales Conversion. You can use it in your daily dashboard, or report. Click to buy Progress Bar Chart in Excel Visit … Continue reading Progress Bar Chart in Excel
Copy and paste this URL into your WordPress site to embed
Copy and paste this code into your site to embed