In today’s fast-paced hiring environment, companies are constantly looking for tools that help streamline their recruitment processes, monitor performance, and gain actionable insights. The Recruitment and Hiring Dashboard in Excel offers an efficient solution for tracking and analyzing all stages of recruitment. This ready-to-use template helps HR teams assess their hiring process, monitor candidate progress, and make data-driven decisions, all in one convenient platform.
In this article, we will explore the Recruitment and Hiring Dashboard in Excel, diving into its features, advantages, best practices, and how it can revolutionize your recruitment efforts. We will also answer some frequently asked questions to provide additional insights into using this powerful tool.
Click to Purchases Recruitment and Hiring Dashboard in Excel
What is a Recruitment and Hiring Dashboard in Excel?
A Recruitment and Hiring Dashboard in Excel is a dynamic tool designed to track, manage, and visualize the entire recruitment process. It helps HR professionals and hiring managers monitor metrics such as candidate status, source effectiveness, departmental hiring trends, and overall hiring success rates. This dashboard offers a comprehensive view of your recruitment process, helping businesses optimize their hiring strategies and improve decision-making.
Key Features of the Recruitment and Hiring Dashboard in Excel
This Excel dashboard comes equipped with several features that make tracking and managing candidates easy and efficient. Let’s take a look at the key features of this dashboard:
Page Navigator:
Located on the left side, this feature allows users to quickly navigate across the various analytical pages of the dashboard. It ensures seamless access to different metrics without having to scroll through multiple sheets.
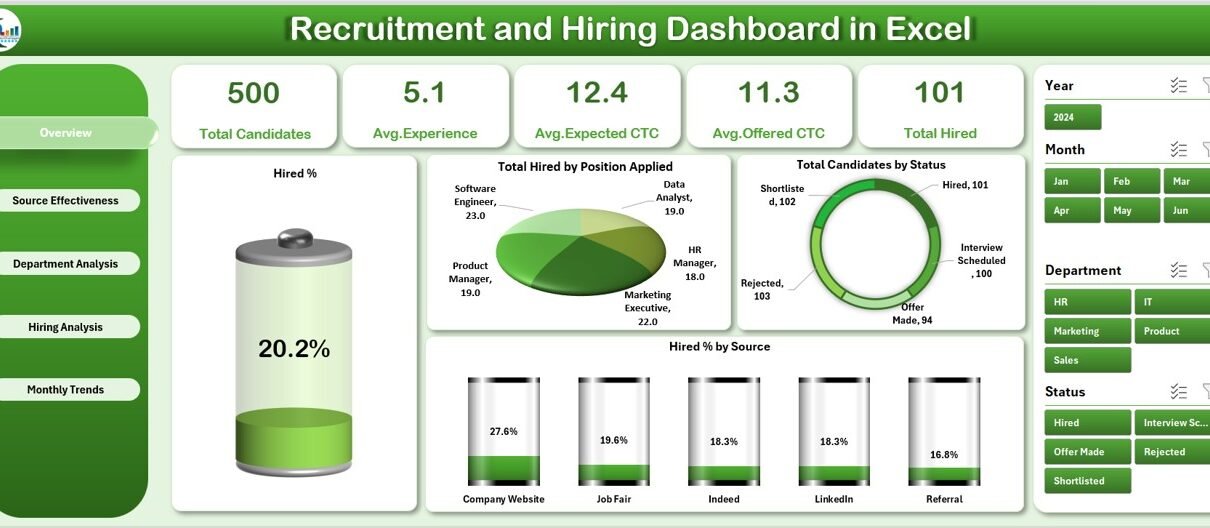
Overview Page:
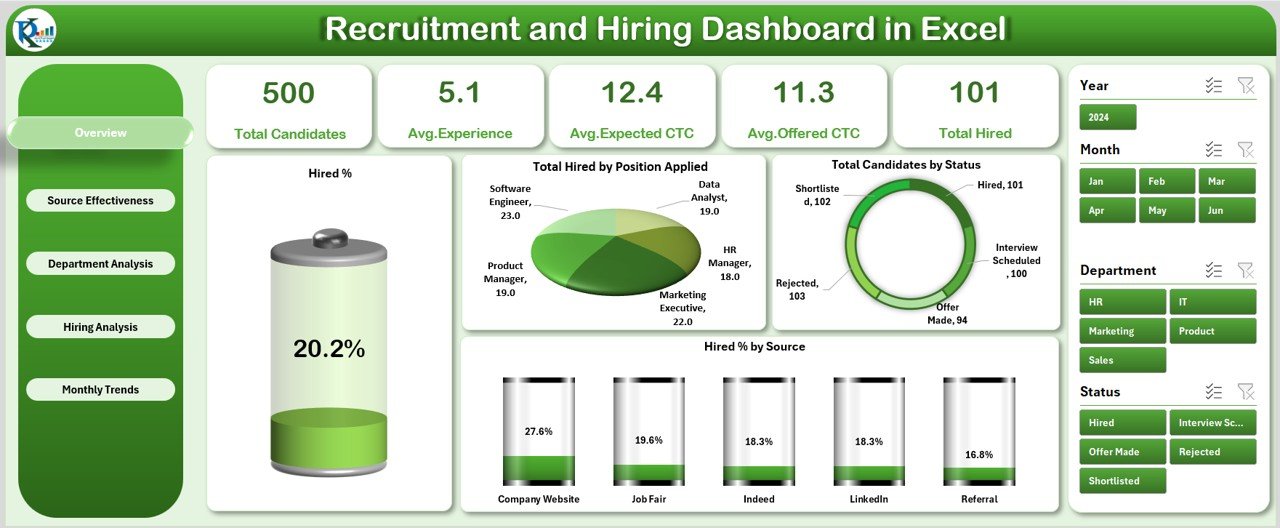
The Overview Page is the central hub of the dashboard. It provides a high-level snapshot of the recruitment process. On the right side, you will find a silencer for data filtering. The page contains five essential cards and four key charts:
- Hired %: Displays the overall hiring success rate.
- Total Hired by Position Applied: Visualizes the number of hires for each position.
- Total Candidates by Status: Provides an overview of candidates in different stages of the hiring process.
- Hired % by Source: Tracks which recruitment channels are most effective.
Click to Purchases Recruitment and Hiring Dashboard in Excel
Source Effectiveness:
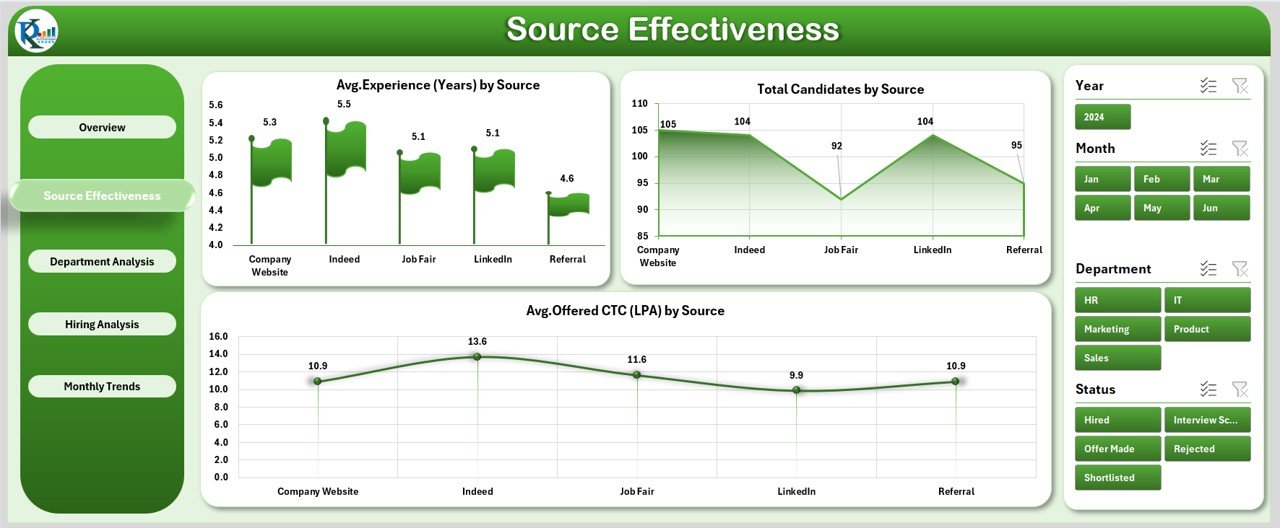
This page focuses on evaluating the performance of different recruitment sources. It includes three essential charts:
- Avg. Experience (Years) by Source: Shows the average years of experience for candidates from different sources.
- Total Candidates by Source: Tracks the number of candidates sourced from various platforms.
- Avg. Offered CTC (LPA) by Source: Displays the average cost-to-company (CTC) for candidates from each recruitment source.
Department Analysis:
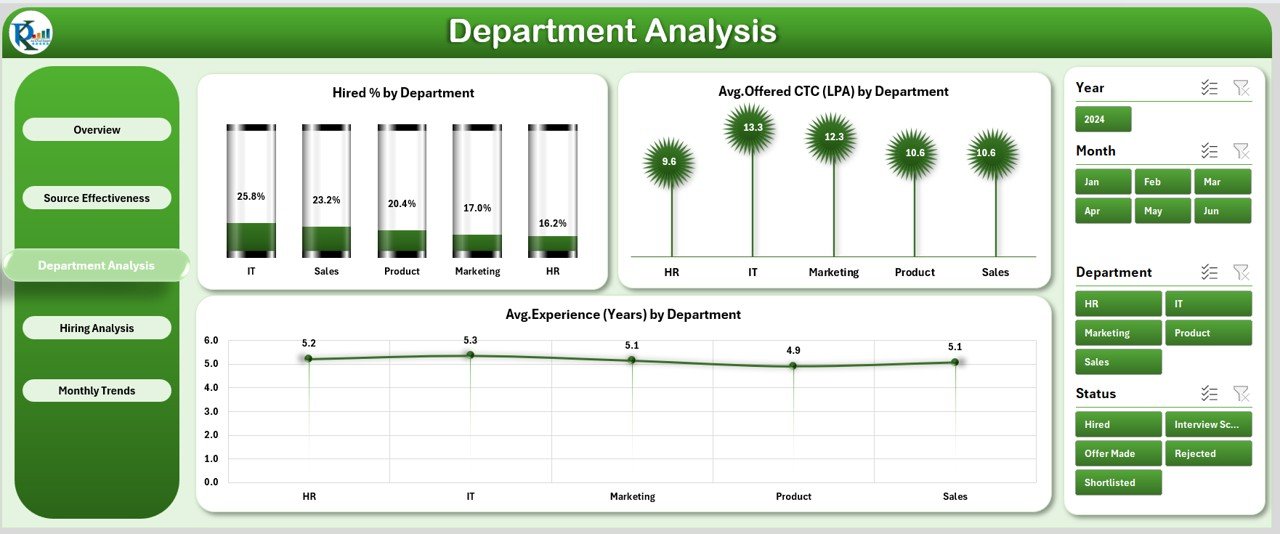
On this page, you can analyze recruitment data across different departments. It helps HR managers identify trends specific to each department. The three key charts include:
- Hired % by Department: Displays the hiring success rate across different departments.
- Avg. Offered CTC (LPA) by Department: Provides insights into the average salary offered by department.
- Avg. Experience (Years) by Department: Highlights the average experience levels within each department.
Hiring Analysis:
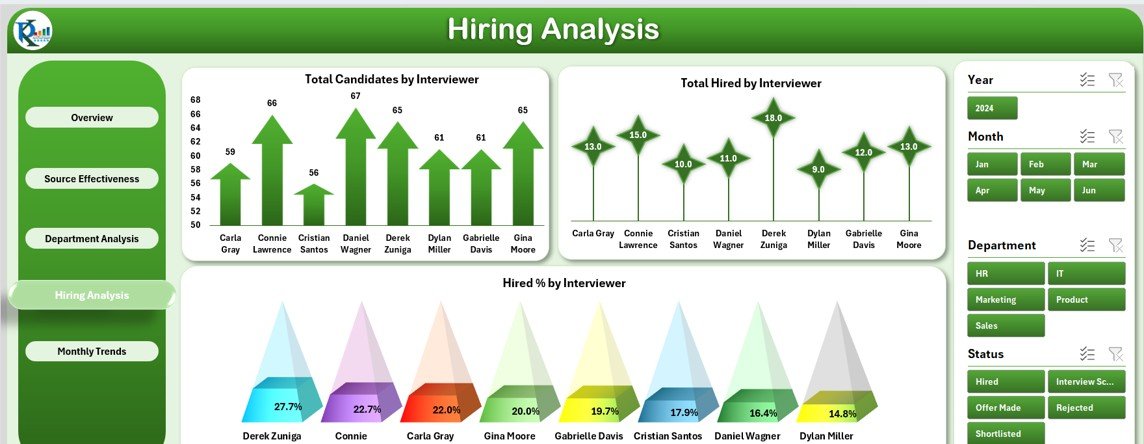
This page tracks the performance of interviewers and their respective hiring success rates. The key charts include:
- Total Candidates by Interviewer: Shows the number of candidates interviewed by each interviewer.
- Total Hired by Interviewer: Tracks the number of candidates hired by each interviewer.
- Hired % by Interviewer: Displays the hiring success rate for each interviewer.
Monthly Trends:
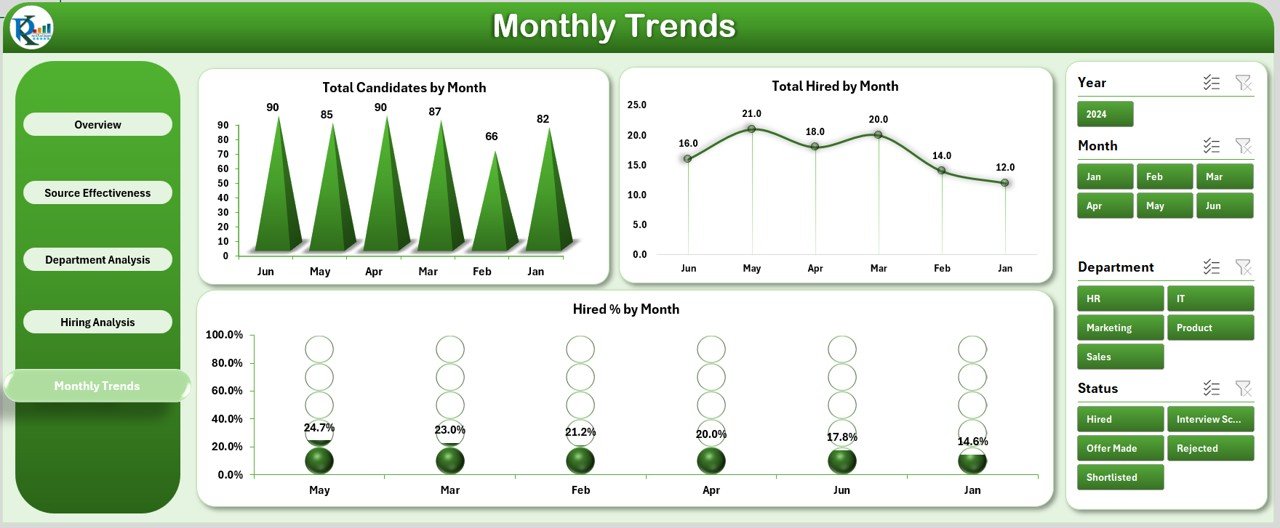
The Monthly Trends page helps you analyze recruitment metrics over time, month by month. It includes the following charts:
- Total Candidates by Month: Displays the number of candidates each month.
- Total Hired by Month: Tracks the number of hires each month.
- Hired % by Month: Shows the hiring success rate over the months.
Advantages of Using a Recruitment and Hiring Dashboard in Excel
The Recruitment and Hiring Dashboard in Excel offers several benefits to HR teams and hiring managers. Here are some of the key advantages:
-
Centralized Data Management:
The dashboard consolidates all recruitment data in one place, making it easy to manage and analyze. This centralization eliminates the need for multiple documents and ensures accurate data tracking. -
Data-Driven Decision Making:
By visualizing key recruitment metrics such as hiring rates, source effectiveness, and interview performance, the dashboard provides valuable insights that guide decision-making. You can quickly identify bottlenecks and areas for improvement. -
Improved Efficiency:
The dashboard simplifies tracking candidate progress, making it easier for HR teams to monitor recruitment status. It reduces the manual effort needed to maintain spreadsheets and generates reports automatically. -
Customizable and Flexible:
The dashboard is highly customizable to suit the specific needs of your organization. You can tailor charts and metrics to reflect the recruitment goals and benchmarks that matter most to your team. -
Real-Time Tracking:
With real-time data updates, HR managers can continuously monitor the effectiveness of their recruitment strategies and make adjustments as needed. This allows for quicker responses to any challenges that arise during the hiring process.
Best Practices for Using the Recruitment and Hiring Dashboard in Excel
To get the most out of your Recruitment and Hiring Dashboard, it’s important to follow best practices that ensure the data remains accurate and actionable. Here are some best practices to follow:
-
Regularly Update Your Data:
Keep the data sheet up to date with new candidate information. Ensure that each field (such as interview dates, decisions, and statuses) is consistently updated for accurate reporting. -
Set Clear KPIs:
Define clear key performance indicators (KPIs) to measure recruitment success. This can include metrics like hiring speed, cost-per-hire, or candidate quality. Tracking these KPIs will help you assess the efficiency of your recruitment efforts. -
Customize the Dashboard:
Adjust the charts and data filters to suit your company’s specific needs. For example, you may want to focus more on source effectiveness or analyze hiring trends by department. Customization allows you to make the dashboard more relevant and impactful for your team. -
Use the Monthly Trends Page to Identify Seasonal Hiring Patterns:
Use the Monthly Trends page to observe any seasonal patterns in recruitment. This will help you plan better for peak hiring periods and ensure that your team is prepared to handle a higher volume of candidates. -
Leverage Source Effectiveness Metrics:
Use the source effectiveness page to evaluate which recruitment channels bring in the best candidates. By focusing on high-performing sources, you can optimize your recruitment budget and improve hiring quality. -
Monitor Interviewer Performance:
Regularly review the Hiring Analysis page to assess the performance of your interviewers. This can help identify potential biases or performance gaps in the interviewing process, ensuring fair and efficient hiring.
Frequently Asked Questions (FAQs)
1. What is the Recruitment and Hiring Dashboard in Excel used for?
The Recruitment and Hiring Dashboard in Excel is used to track and analyze all stages of the recruitment process, from candidate sourcing to hiring success. It helps HR teams monitor key metrics, assess recruitment strategies, and make data-driven decisions.
2. How can I customize the Recruitment and Hiring Dashboard?
The dashboard is highly customizable. You can adjust the charts, filters, and KPIs to match your specific recruitment needs. You can also modify the data fields to reflect the particular stages of your recruitment process.
3. How do I update the data in the Recruitment and Hiring Dashboard?
To update the dashboard, simply add or modify candidate information in the data sheet. Ensure that fields like Candidate Name, Position Applied, Status, and Source are regularly updated for accurate reporting.
4. Can the Recruitment and Hiring Dashboard be used for large organizations?
Yes, the dashboard is scalable and can be used for organizations of all sizes. It can handle large datasets and provide insights at a granular level, such as by department, source, or interviewer.
5. Is the Recruitment and Hiring Dashboard compatible with other HR tools?
Click to Purchases Recruitment and Hiring Dashboard in Excel
Yes, the dashboard can be integrated with other HR systems. You can import data from external sources and use Excel’s built-in tools to merge the information for analysis.
Conclusion
The Recruitment and Hiring Dashboard in Excel is an indispensable tool for modern HR departments. It centralizes your recruitment data, streamlines hiring processes, and provides real-time insights into your hiring strategies. By following best practices and customizing the dashboard to fit your organization’s needs, you can significantly improve the efficiency and effectiveness of your recruitment efforts.
Visit our YouTube channel to learn step-by-step video tutorials