The wood and furniture manufacturing industry faces constant pressure to improve efficiency, control costs, reduce waste, and meet customer demand on time. Because margins remain tight and competition continues to grow, manufacturers can no longer rely on intuition or scattered reports. Instead, they need a structured, visual, and reliable performance tracking system.
That is exactly where a Wood & Furniture Manufacturing KPI Dashboard in Power BI delivers powerful value.
In this detailed, SEO-friendly, and easy-to-understand guide, you will learn what a Wood & Furniture Manufacturing KPI Dashboard in Power BI is, why it matters, how it works, its page-wise structure, data requirements, key KPIs, advantages, best practices, and frequently asked questions. Moreover, this article uses clear language, strong transitions, and practical explanations so that decision-makers can apply the insights immediately.
Click to buy Wood & Furniture Manufacturing KPI Dashboard in Power BI
What Is a Wood & Furniture Manufacturing KPI Dashboard in Power BI?
A Wood & Furniture Manufacturing KPI Dashboard in Power BI is a ready-to-use, interactive performance monitoring tool designed specifically for wood processing units, furniture factories, carpentry workshops, and manufacturing plants.
Instead of tracking production, quality, cost, and efficiency using multiple spreadsheets, this dashboard consolidates all key performance indicators into one visual and dynamic Power BI report. As a result, managers gain instant clarity on how the business performs at both operational and strategic levels.
Because this dashboard connects to an Excel data source, teams can easily update actuals and targets without complex systems. Consequently, even small and mid-sized manufacturers can adopt data-driven decision-making quickly.
Why Do Wood & Furniture Manufacturers Need a KPI Dashboard?
Wood and furniture manufacturing involves multiple moving parts. Raw material costs fluctuate. Production efficiency varies by shift. Quality defects impact profitability. Delivery delays affect customer trust. Therefore, manufacturers must track performance continuously.
A KPI dashboard solves these challenges because it:
- Centralizes all performance data in one place
- Highlights target achievement and gaps clearly
- Supports faster and smarter decision-making
- Reduces manual reporting effort
- Improves accountability across teams
Moreover, when leadership reviews performance visually, they can act immediately instead of waiting for monthly reports.
How Does the Wood & Furniture Manufacturing KPI Dashboard in Power BI Work?
The Wood & Furniture Manufacturing KPI Dashboard in Power BI works by combining Excel-based data entry with Power BI visualization and analytics.
First, users enter actual values, targets, and KPI definitions into structured Excel sheets. Then, Power BI reads this data and automatically calculates Month-to-Date (MTD), Year-to-Date (YTD), target variance, and year-over-year comparisons. Finally, the dashboard presents insights using cards, tables, icons, slicers, and trend charts.
Because Power BI handles calculations and visuals, users only focus on maintaining clean input data. As a result, reporting becomes faster, consistent, and error-free.
What Are the Key Pages in the Wood & Furniture Manufacturing KPI Dashboard in Power BI?
This dashboard contains three well-structured pages, each designed for a specific purpose. Together, they provide complete performance visibility.
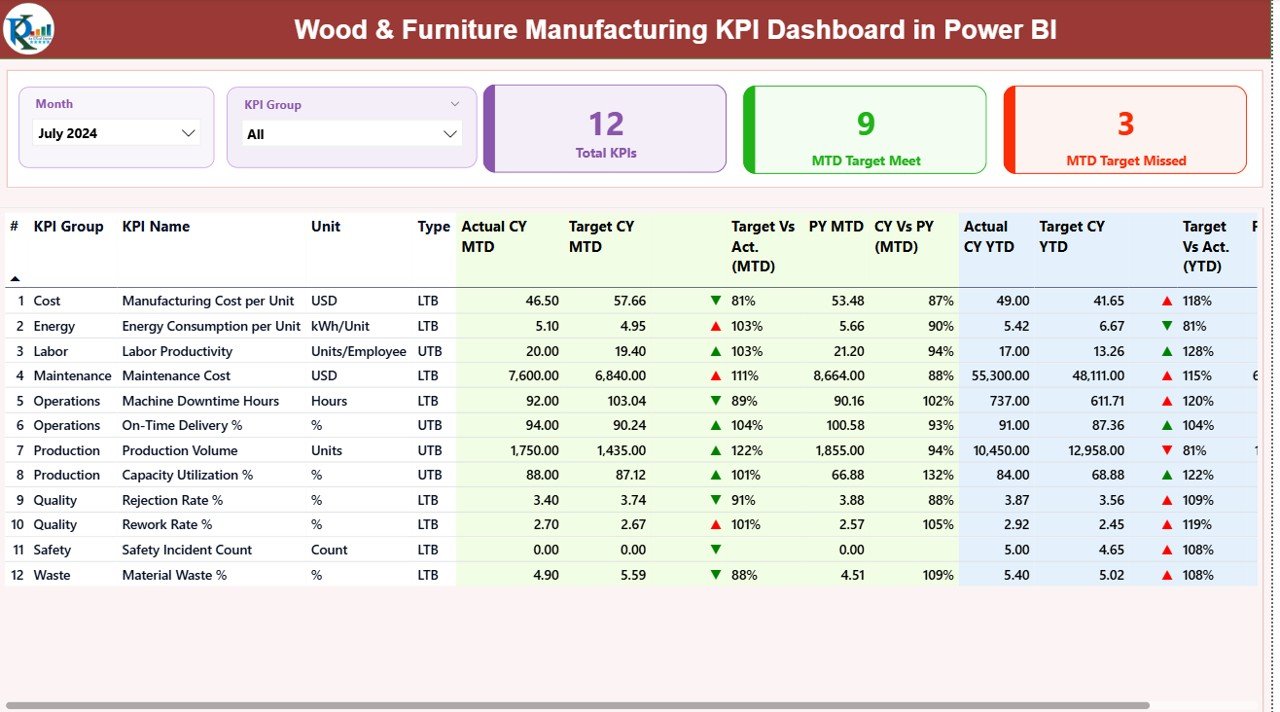
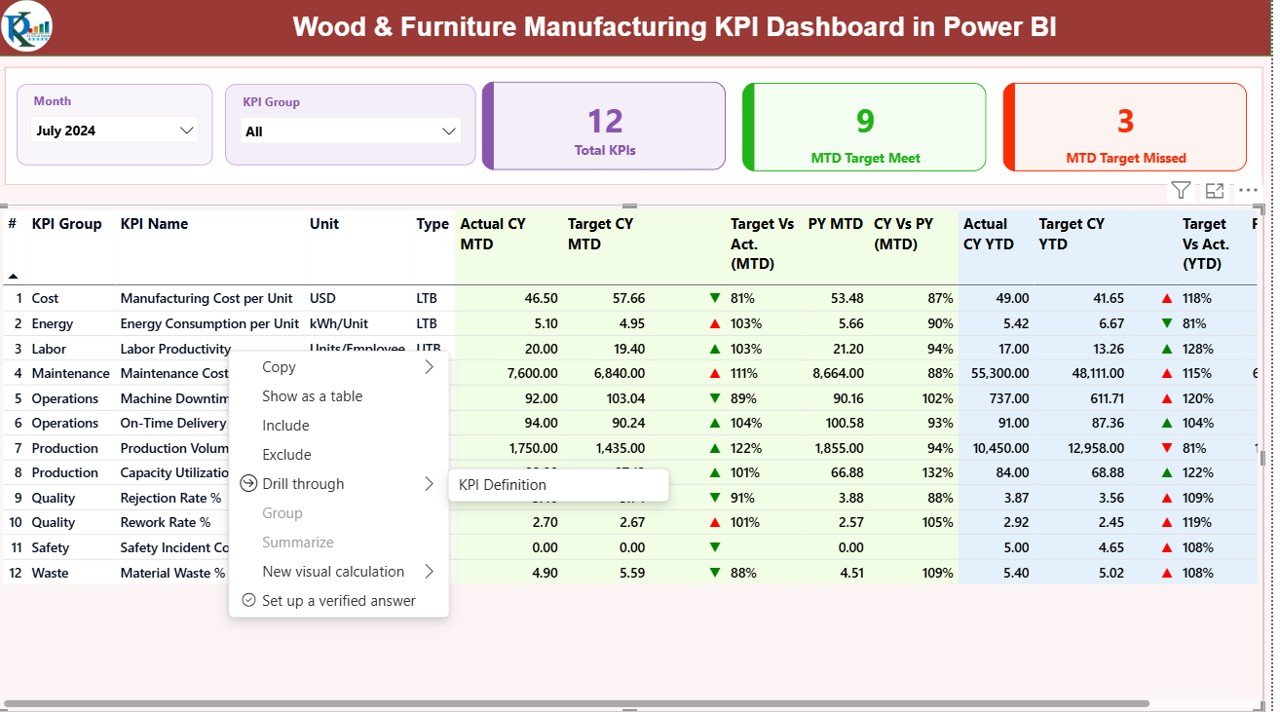
the Summary Page
The Summary Page serves as the main landing page of the dashboard. It provides a high-level overview of all KPIs at once.
Key Elements of the Summary Page
- Month Slicer
Allows users to select the reporting month. As a result, all numbers update dynamically. - KPI Group Slicer
Helps users filter KPIs by category such as Production, Quality, Cost, Maintenance, or Safety. - Top KPI Cards
Total KPIs Count
MTD Target Met Count
MTD Target Missed Count
These cards instantly show overall performance status.
Detailed KPI Table in the Summary Page
Below the cards, the dashboard displays a detailed KPI table that includes:
- KPI Number – Sequence number for tracking
- KPI Group – Category of the KPI
- KPI Name – Name of the performance metric
- Unit – Unit of measurement (%, hours, units, cost, etc.)
- Type – UTB (Upper the Better) or LTB (Lower the Better)
MTD Performance Columns
- Actual CY MTD
- Target CY MTD
- MTD Status Icon (▲ or ▼ with green/red color)
- Target vs Actual (MTD %)
- PY MTD
- CY vs PY (MTD %)
YTD Performance Columns
- Actual CY YTD
- Target CY YTD
- YTD Status Icon (▲ or ▼)
- Target vs Actual (YTD %)
- PY YTD
- CY vs PY (YTD %)
Because the table shows both MTD and YTD performance, managers can analyze short-term and long-term trends together.
Click to buy Wood & Furniture Manufacturing KPI Dashboard in Power BI
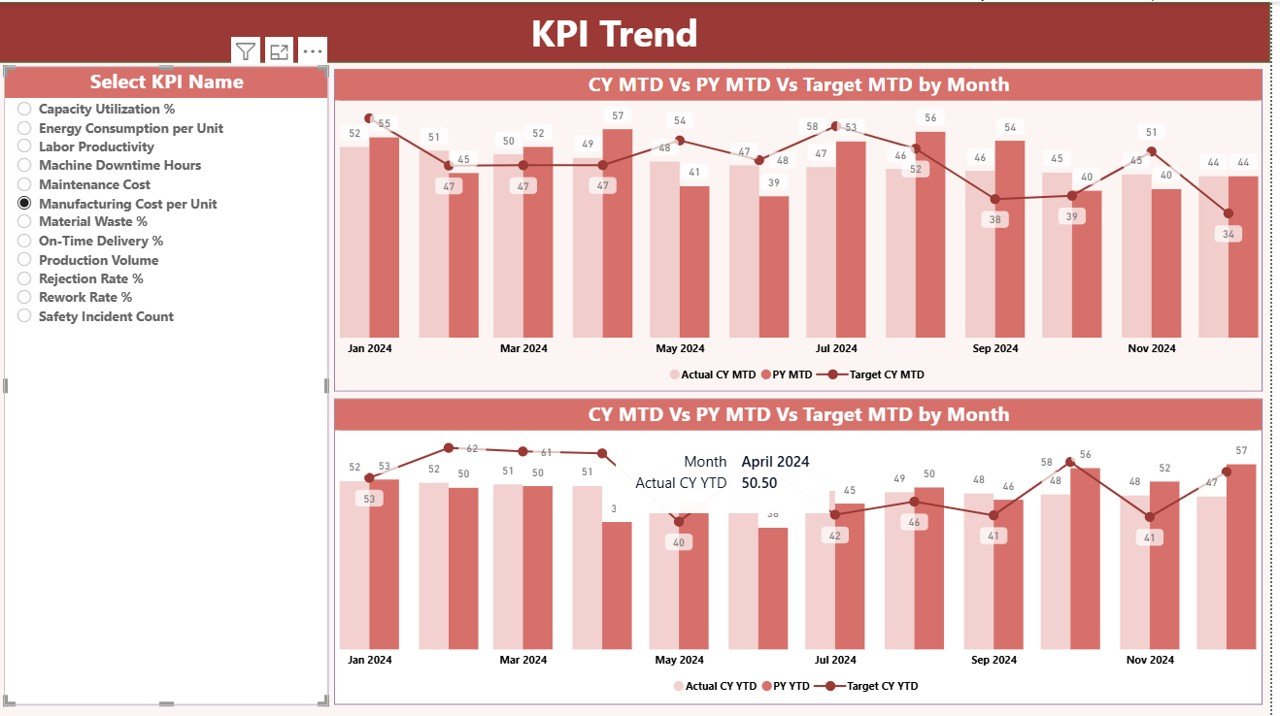
KPI Trend Page
The KPI Trend Page focuses on deep analysis of individual KPIs.
Key Features of the KPI Trend Page
- KPI Name Slicer
Allows users to select a specific KPI for detailed analysis. - MTD Combo Chart
Displays: - Current Year Actual
- Previous Year Actual
- Target
- YTD Combo Chart
Displays: - Current Year Actual
- Previous Year Actual
- Target
These charts help users understand whether performance improves, declines, or remains stable over time. Therefore, managers can quickly identify recurring issues or consistent improvements.
Click to buy Wood & Furniture Manufacturing KPI Dashboard in Power BI
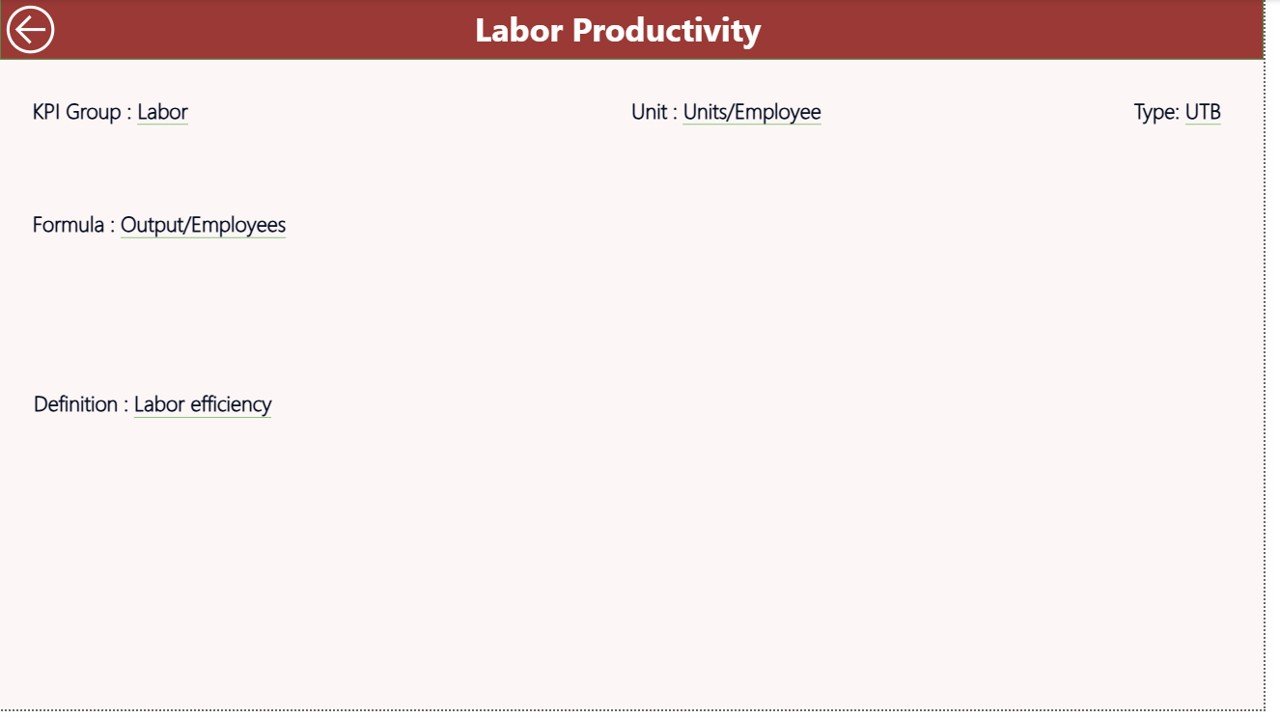
KPI Definition Page
The KPI Definition Page acts as a drill-through and reference page. It remains hidden from direct navigation to maintain a clean user experience.
What Does the KPI Definition Page Show?
- KPI Number
- KPI Group
- KPI Name
- Unit of Measurement
- Formula
- KPI Definition
- KPI Type (LTB or UTB)
From the Summary Page, users can drill through to this page to understand how a KPI works and how calculations happen. This approach ensures transparency and avoids confusion during reviews.
A simple back button allows users to return to the main page instantly.
Click to buy Wood & Furniture Manufacturing KPI Dashboard in Power BI
What Excel Data Is Required for the Dashboard?
The Wood & Furniture Manufacturing KPI Dashboard in Power BI uses an Excel file as its data source. This design keeps data management simple and flexible.
Excel Sheets Used in the Dashboard
Input_Actual Sheet
In this sheet, users enter actual performance values.
Required fields include:
- KPI Name
- Month (use the first date of the month)
- MTD Actual Value
- YTD Actual Value
Because this sheet captures real performance, accuracy matters most.
Input_Target Sheet
In this sheet, users enter target values.
Required fields include:
- KPI Name
- Month (use the first date of the month)
- MTD Target Value
- YTD Target Value
Targets help the dashboard calculate achievement percentages and status icons.
Click to buy Wood & Furniture Manufacturing KPI Dashboard in Power BI
KPI Definition Sheet
This sheet defines the structure and meaning of each KPI.
Required fields include:
- KPI Number
- KPI Group
- KPI Name
- Unit
- Formula
- Definition
- Type (LTB or UTB)
Because definitions remain standardized, reporting stays consistent across departments.
Which KPIs Can You Track in a Wood & Furniture Manufacturing Dashboard?
This dashboard supports a wide range of KPIs relevant to wood and furniture manufacturing operations, such as:
- Production Output
- Machine Utilization Rate
- Downtime Hours
- Material Waste Percentage
- Defect Rate
- Rework Percentage
- On-Time Delivery Rate
- Labor Productivity
- Energy Consumption
- Cost per Unit
- Inventory Turnover
- Safety Incident Rate
Because the dashboard supports flexible KPI definitions, organizations can customize it to match their exact operational needs.
Advantages of Wood & Furniture Manufacturing KPI Dashboard in Power BI
A Wood & Furniture Manufacturing KPI Dashboard in Power BI offers several strong advantages.
Centralized Performance Visibility
The dashboard brings all KPIs into one view. As a result, managers no longer chase multiple reports.
Faster Decision-Making
Because insights update instantly, leadership can act immediately on issues.
Improved Accountability
Clear target vs actual tracking ensures every team understands expectations.
Reduced Manual Effort
Automation eliminates repetitive reporting tasks and formula errors.
Easy Excel Integration
Since data entry happens in Excel, adoption remains smooth for all users.
Better Trend Analysis
MTD and YTD comparisons highlight performance patterns clearly.
Scalable and Customizable
Organizations can add or modify KPIs as operations grow.
Best Practices for the Wood & Furniture Manufacturing KPI Dashboard in Power BI
To get maximum value from the dashboard, follow these proven best practices.
Define KPIs Clearly
Always write clear definitions and formulas. This approach avoids misinterpretation.
Update Data Regularly
Update actuals and targets monthly to maintain accuracy.
Use Meaningful KPI Groups
Group KPIs logically, such as Production, Quality, Cost, and Safety.
Review MTD and YTD Together
Short-term results matter, but long-term trends matter more.
Train Teams on Interpretation
Ensure managers understand icons, percentages, and comparisons.
Focus on Action, Not Just Reporting
Use insights to drive corrective actions and improvements.
Who Can Benefit from This Dashboard?
The Wood & Furniture Manufacturing KPI Dashboard in Power BI benefits:
- Factory Managers
- Production Supervisors
- Operations Heads
- Quality Managers
- Maintenance Teams
- Finance and Cost Controllers
- Business Owners
Because the dashboard presents insights visually, even non-technical users can understand it easily.
Conclusion: Why This Dashboard Is a Must-Have for Wood & Furniture Manufacturers
In today’s competitive manufacturing environment, data-driven decision-making defines success. A Wood & Furniture Manufacturing KPI Dashboard in Power BI transforms raw operational data into clear, actionable insights.
By combining Excel-based data entry with powerful Power BI visuals, this dashboard delivers speed, clarity, and control. Moreover, it helps manufacturers reduce waste, improve productivity, meet targets, and strengthen profitability.
If your organization aims to move beyond manual reports and reactive decisions, this dashboard provides the perfect foundation.
Frequently Asked Questions (FAQs)
What is a Wood & Furniture Manufacturing KPI Dashboard in Power BI?
It is a ready-to-use Power BI dashboard that tracks manufacturing KPIs using Excel as a data source.
Do I need advanced Power BI skills to use this dashboard?
No. You only need basic Excel skills to update data.
Can I customize KPIs in the dashboard?
Yes. You can add, modify, or remove KPIs using the KPI Definition sheet.
Does the dashboard support MTD and YTD analysis?
Yes. It provides both MTD and YTD actuals, targets, and comparisons.
Is this dashboard suitable for small manufacturers?
Yes. Its Excel-based design makes it ideal for small and mid-sized units.
Can I track both UTB and LTB KPIs?
Yes. The dashboard supports both Upper-the-Better and Lower-the-Better KPIs.
How often should I update the data?
You should update data monthly for accurate insights.
Can this dashboard improve decision-making?
Absolutely. It provides clear, visual insights that support faster and better decisions.
Visit our YouTube channel to learn step-by-step video tutorials
Watch the step-by-step video tutorial:
Click to buy Wood & Furniture Manufacturing KPI Dashboard in Power BI