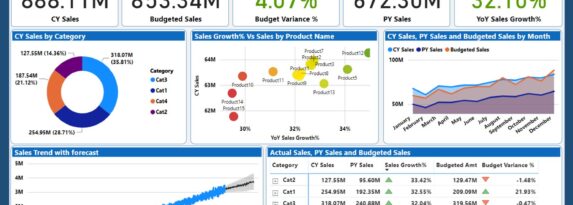
Comparative Analysis Dashboard in Power BI
The Comparative Analysis Dashboard in Power BI compares current-year sales with previous-year sales and budget. It shows year-over-year growth, budget variance, category and product analysis, and monthly trends. The example extends the reporting ideas in our Power BI sales dashboard tutorial. How to Interpret the Comparisons Comparison Question it answers Current-year and previous-year sales How … Continue reading Comparative Analysis Dashboard in Power BI
