Custom Visual: Liquid Fill Gauge in Power BI
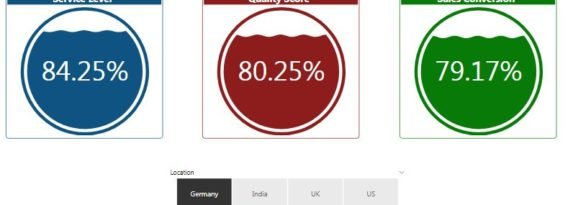
Liquid Fill Gauge is very beautiful Custom visual for Power BI. You can use this chart to display metrics like – Service Level, Quality Score, Sales conversion etc. You can download this custom visual from GitHub. Below is the link: https://github.com/jongio/PowerBI-visuals-liquidFillGauge We have created the sample for dummy data points. Below is the snapshot- … Continue reading Custom Visual: Liquid Fill Gauge in Power BI