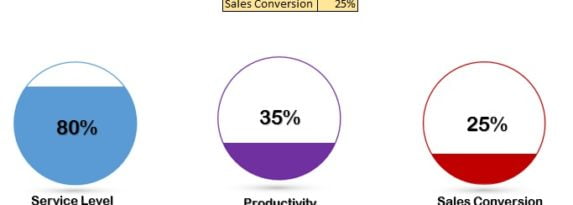
Filling Circle Chart is very informative visual in excel created by our team. This chart can be used for a KPI Metrics like- Service Level, Quality Score, Sales Conversion etc. Filled are of the circle shows the metric performance. To create this chart, we have taken the support of power point presentation to merge the … Continue reading Filling Circle Chart
Copy and paste this URL into your WordPress site to embed
Copy and paste this code into your site to embed