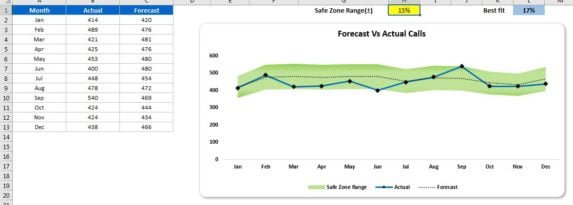
Forecast Vs Actual Chart with Safe Zone Range in Excel
In this article, we have created a Forecast Vs Actual Chart with Safe Zone Range. This is a very informative chart wherein you can display that your actual numbers are within the forecast range or not. We have below given data to create this chart- We have created a below given chart where we have … Continue reading Forecast Vs Actual Chart with Safe Zone Range in Excel
Copy and paste this URL into your WordPress site to embed
Copy and paste this code into your site to embed