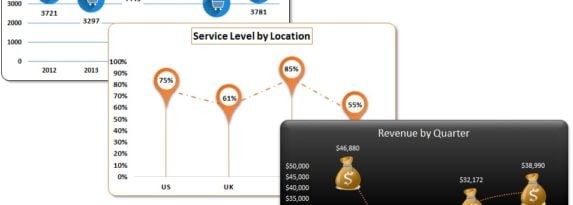
Line charts, as an efficient means of tracking and showcasing data trends over time, have become a go-to solution for visualizing metrics such as sales, revenue, and others. In this article, we delve into the use of Info-graphics with Line Chart in Microsoft Excel. We’ll take a closer look at three distinct line charts, each … Continue reading Info-graphics with Line Chart
0 Comments