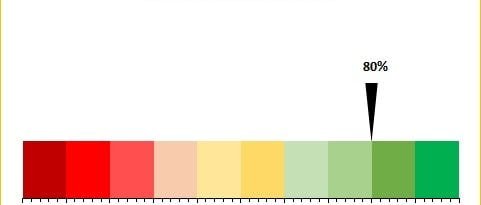
Informative KPI Indicator Chart (Version-1)
I am back with one more stunning and Informative KPI Indicator Chart. In this chart I have used a RAG color pallet in 10 slices (10% each). Here I have taken Service Level metrics, you can take your own metrics. As soon as you will change the Service Level%, Indicator will be moved accordingly. Informative … Continue reading Informative KPI Indicator Chart (Version-1)
0 Comments