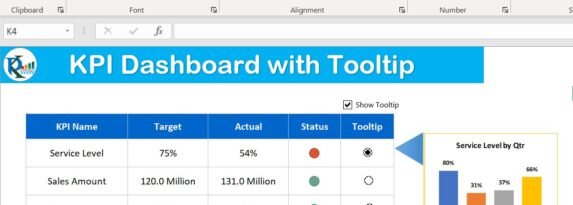
KPI Dashboard with Tooltip in Excel
In this article, we have created Chart Tooltip in KPI Dashboard in Microsoft Excel. You can use this trick to show the details of a number with the chart. We have taken 3 KPIs here – Service Level, Sales Amount, and Attendance%. We are showing Quarterly Service Level Tooltip for Service Level, Sales by Country, … Continue reading KPI Dashboard with Tooltip in Excel
Copy and paste this URL into your WordPress site to embed
Copy and paste this code into your site to embed