In this article, we have created Chart Tooltip in KPI Dashboard in Microsoft Excel. You can use this trick to show the details of a number with the chart.
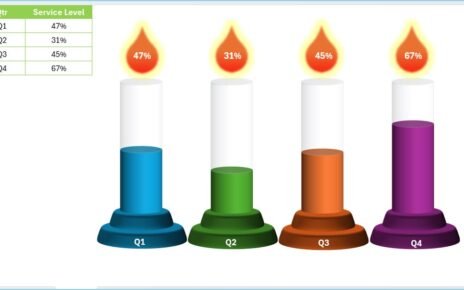
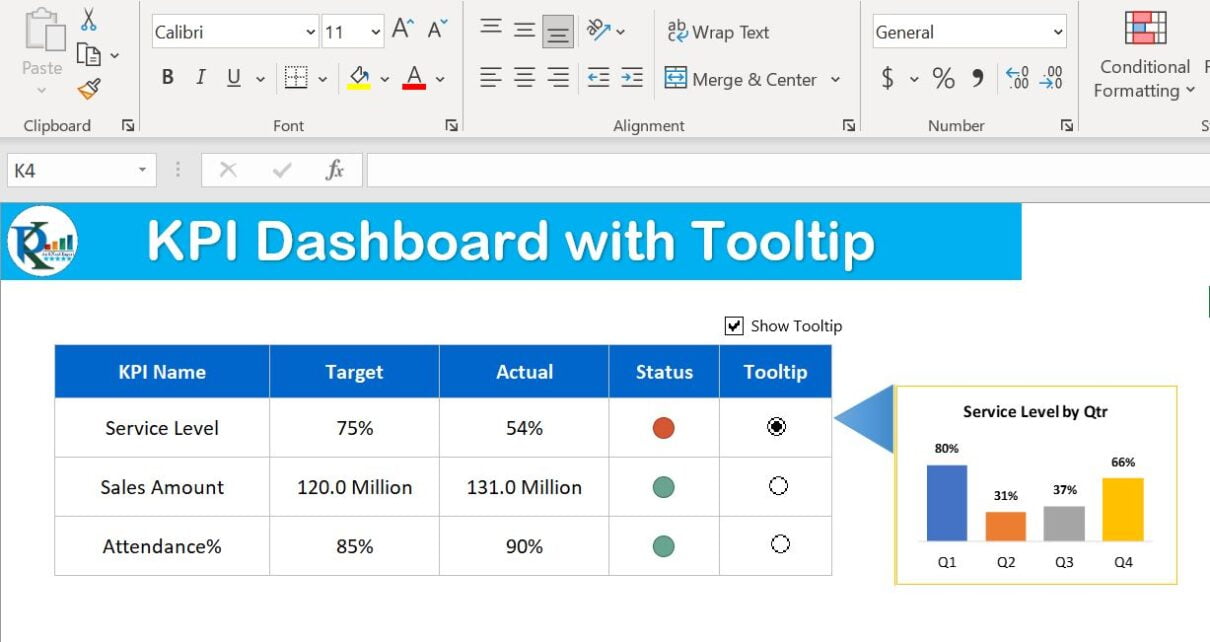
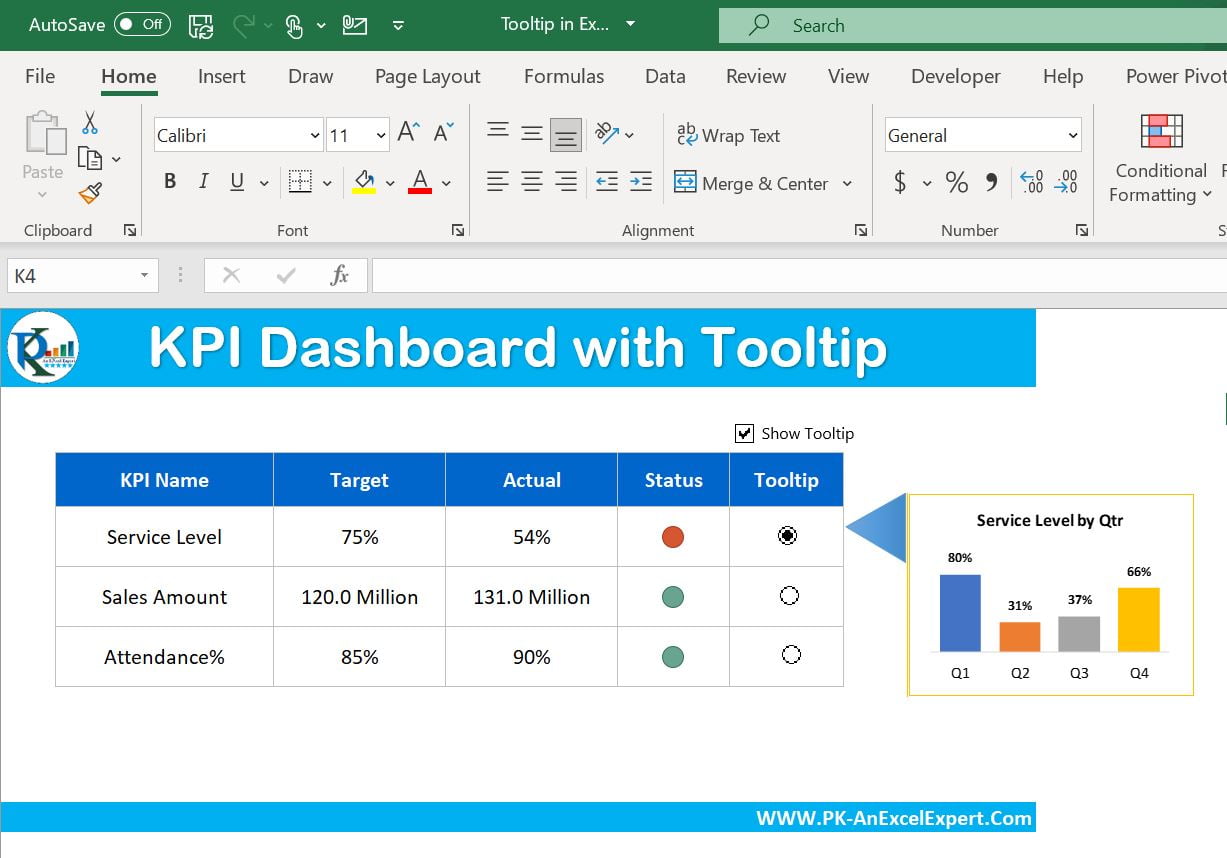
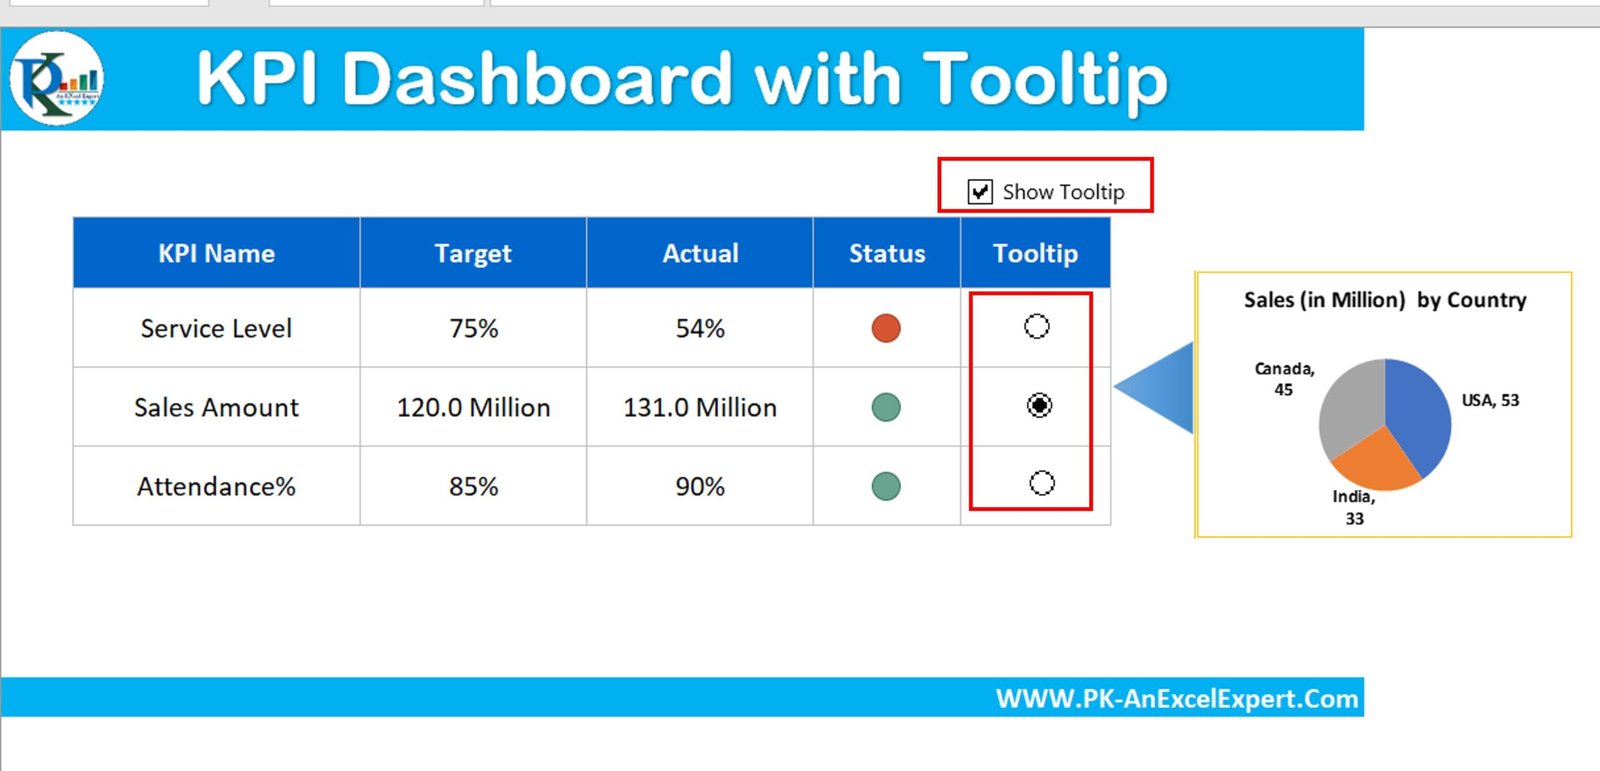
We have taken 3 KPIs here – Service Level, Sales Amount, and Attendance%. We are showing Quarterly Service Level Tooltip for Service Level, Sales by Country, Team Leader wise Attendance% on Tooltip.
KPI Dashboard with Tooltip in Excel
This is a ready to use template. You can customize it with our own data. You can also add more KPIs as per your requirements.
Click to buy KPI Dashboard with Tooltip in Excel
To show the tooltip, you need to check the Show Tooltip check box and then select the related option button in Tooltip Column.
Click to buy KPI Dashboard with Tooltip in Excel
Visit our YouTube channel to learn step-by-step video tutorials
Watch the step by step video tutorial:
Click to buy KPI Dashboard with Tooltip in Excel