New: NextGenTemplates Academy - video courses on Excel formulas with AI and Pivot Tables & dashboards. Early-bird: 20% off with code EARLYBIRD20 - first 20 orders only. See the courses →
  • Learn Excel (Free Course)
    • 1. Shortcut Keys
    • 2. Fill & Flash Fill
    • 3. Find & Replace
    • 4. Sort & Filter
    • 5. Formulas & Functions
    • 6. Data Validation
    • 7. Conditional Formatting
    • 8. Basic Charts
    • 9. Advanced Charts
    • 10. Pivot Tables
    • 11. Excel Dashboards
    • 12. VBA Course
    • 13. Excel Formulas with AI
  • Templates
  • Tutorials
    • Charts and Visualization
    • VBA
    • Excel Tips and Tricks
    • Excel Dashboards
    • Power Pivot & DAX
  • Power BI
  • Template Store
    • Ready to Use Templates
  • Courses
  • Academy
    • Excel + AI Mastery: 100 Formulas
    • Excel Pivot Tables & Dashboards
  • About Us
  • Contact Us

PK: An Excel Expert

Transforming Data into Decisions

Tag: Tooltip in Power BI

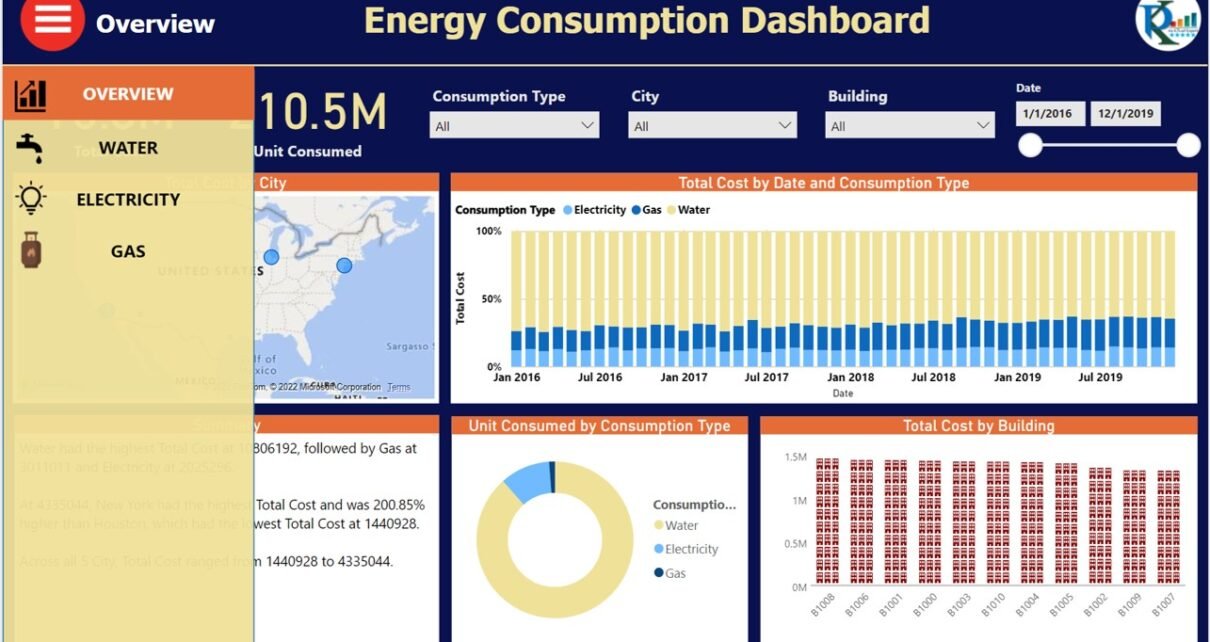
Energy Consumptions Dashboard
Power BI

Energy Consumptions Dashboard in Power BI

March 1, 2022March 27, 2024 PKComments Off on Energy Consumptions Dashboard in Power BI
We have created this Energy Consumptions Dashboard in Microsoft Power BI. We have explained step by step data transformation in Power Query, Creation of the Relationship between fact & dimension
Read More
Tooltip in Excel
Charts and Visualization

KPI Dashboard with Tooltip in Excel

August 8, 2021March 2, 2025 PKComments Off on KPI Dashboard with Tooltip in Excel
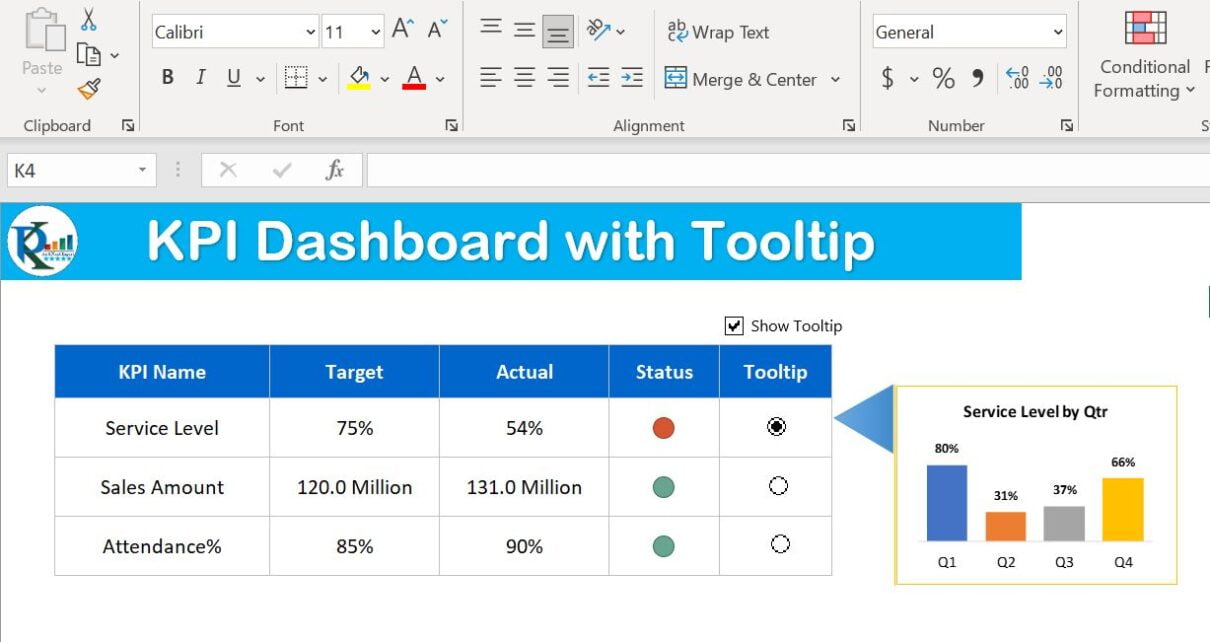
In this article, we have created Chart Tooltip in KPI Dashboard in Microsoft Excel. You can use this trick to show the details of a number with the chart. We
Read More
3 Ways to drill through
Power BI

Power BI Drillthrough: Right Click, Buttons and Tooltips

May 27, 2021October 10, 2026 PKComments Off on Power BI Drillthrough: Right Click, Buttons and Tooltips
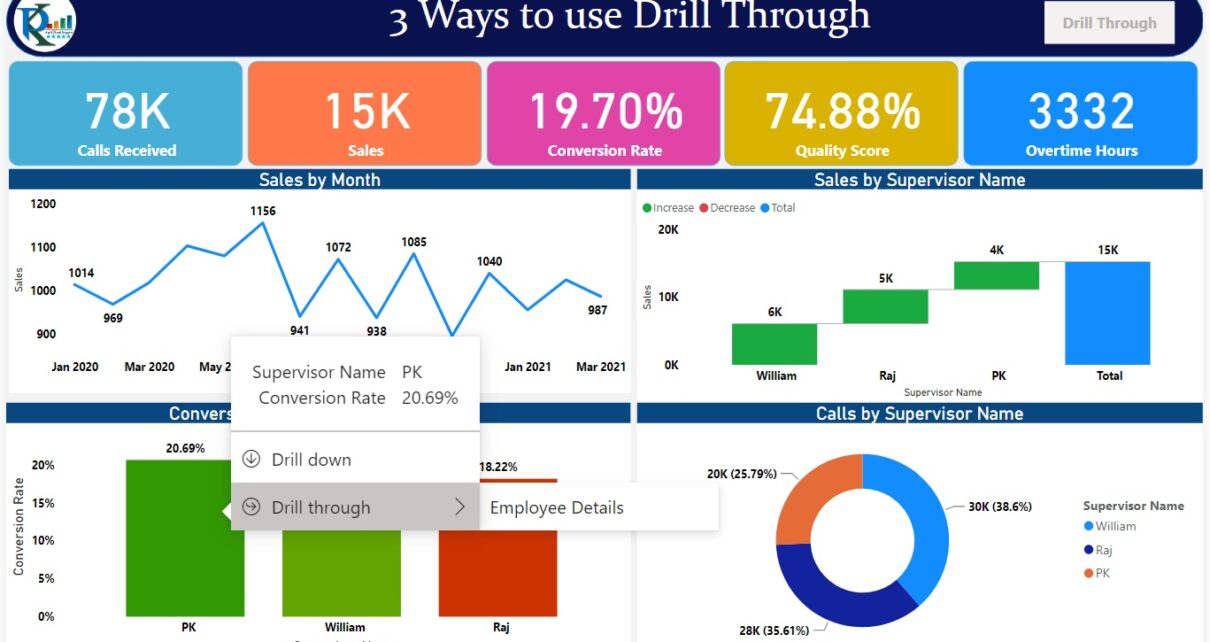
Power BI drillthrough opens a report page filtered to the selected data point. This tutorial demonstrates three ways to start it: a right-click menu, a button and a tooltip action.
Read More
Quality Analysis Dashboard
Power BI

Quality Analysis Dashboard in Power BI

September 27, 2020September 19, 2026 PKComments Off on Quality Analysis Dashboard in Power BI
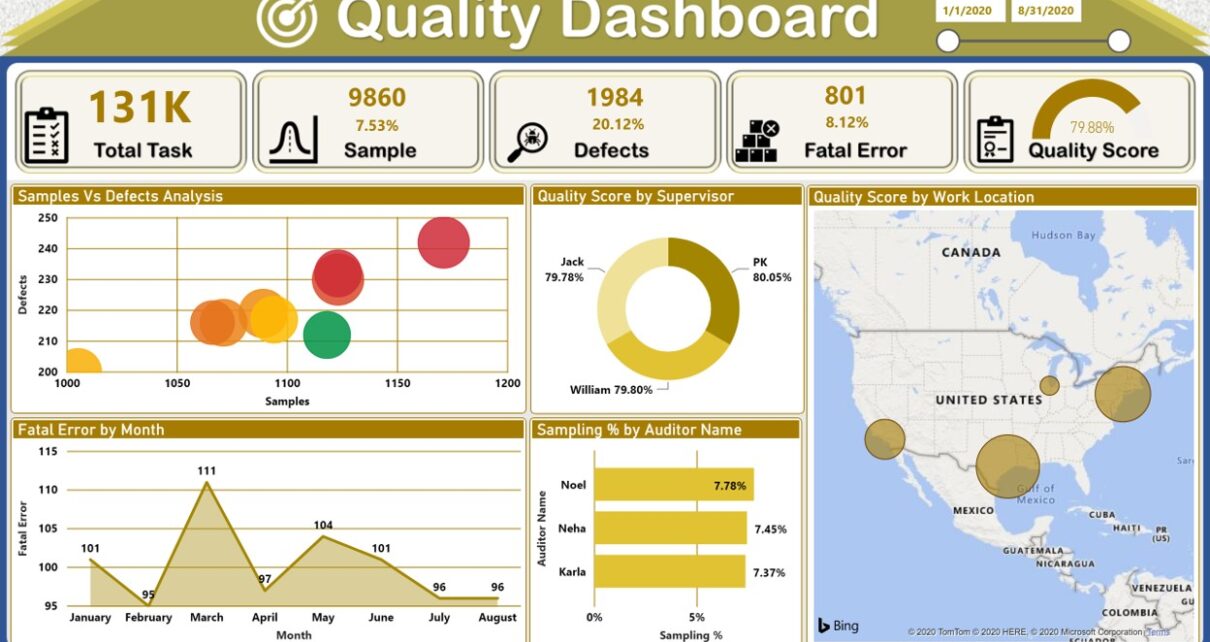
The Quality Analysis Dashboard in Power BI uses sample data to present Total Task, Sample, Defect, Fatal Error and Quality Score. Its main page summarises results with charts and cards;
Read More
BI Dashboard
Power BI

Comparative Analysis Dashboard in Power BI

September 6, 2020September 19, 2026 PKComments Off on Comparative Analysis Dashboard in Power BI
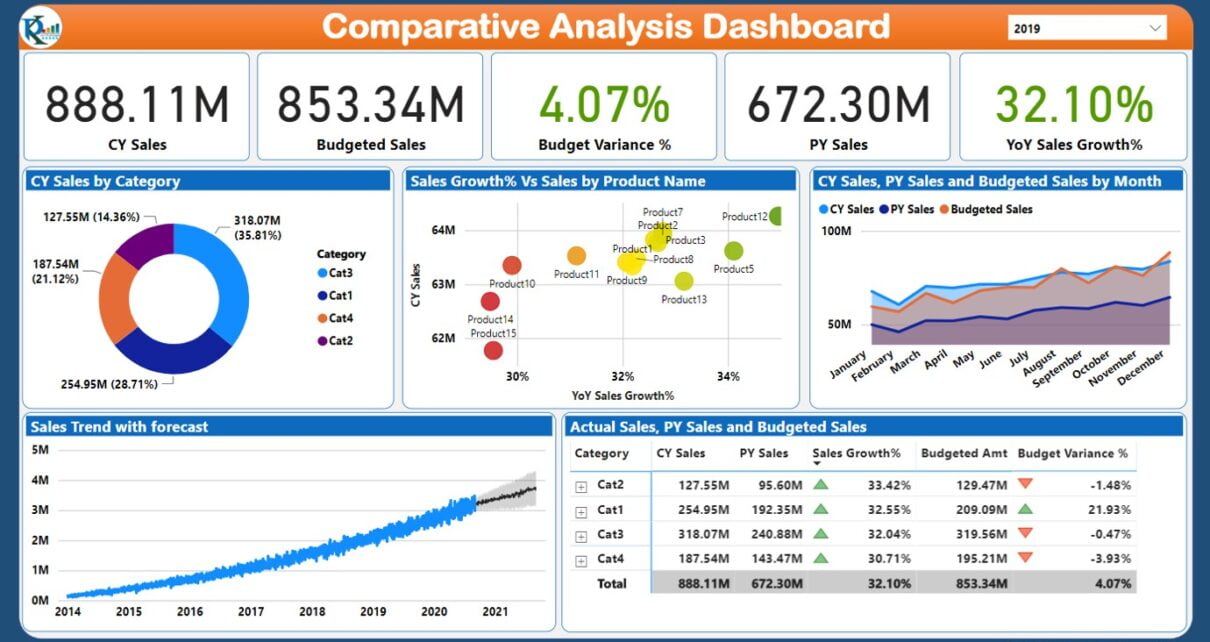
The Comparative Analysis Dashboard in Power BI compares current-year sales with previous-year sales and budget. It shows year-over-year growth, budget variance, category and product analysis, and monthly trends. The example
Read More
Power BI Tooltips: Format and Create Report Page Tooltips
Power BI

Power BI Tooltips: Format and Create Report Page Tooltips

May 1, 2019October 9, 2026 PKComments Off on Power BI Tooltips: Format and Create Report Page Tooltips
Power BI tooltips are the small boxes that pop up when you hover over a data point. By default they show the field names and values in a dark box,
Read More
  • Learn Excel (Free Course)
    • 1. Shortcut Keys
    • 2. Fill & Flash Fill
    • 3. Find & Replace
    • 4. Sort & Filter
    • 5. Formulas & Functions
    • 6. Data Validation
    • 7. Conditional Formatting
    • 8. Basic Charts
    • 9. Advanced Charts
    • 10. Pivot Tables
    • 11. Excel Dashboards
    • 12. VBA Course
    • 13. Excel Formulas with AI
  • Templates
  • Tutorials
    • Charts and Visualization
    • VBA
    • Excel Tips and Tricks
    • Excel Dashboards
    • Power Pivot & DAX
  • Power BI
  • Template Store
    • Ready to Use Templates
  • Courses
  • Academy
    • Excel + AI Mastery: 100 Formulas
    • Excel Pivot Tables & Dashboards
  • About Us
  • Contact Us
Copyright © 2023 PK-AnExcelExpert.com - Privacy Policy