In this article you will learn how to Customized Tooltip in Power BI and how to use a Report page as tooltip in Power BI, Tooltip is very useful feature available in Power BI. You can Customized Tooltip the tooltip like- background color, Font Name, Font Size, Font color etc.
Below are the steps to customize a Default Tooltip:
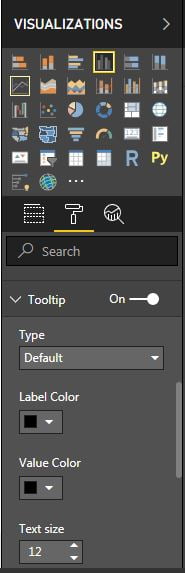
- Select the visual and Go to Format
- Change the Label Color, Value Color, Text Size, Font Family, Background color etc. as per your requirements Customized Tooltip.
Customized Tooltip
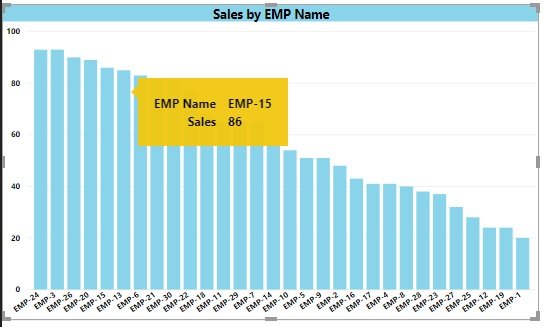
- Now tooltip will be changed accordingly.
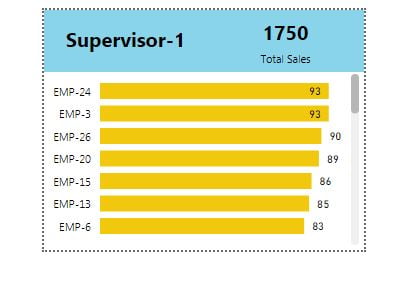
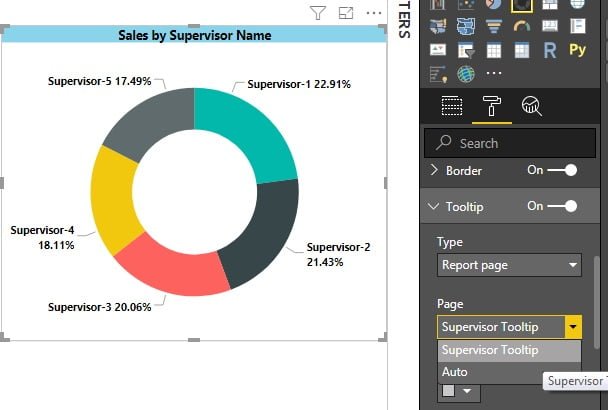
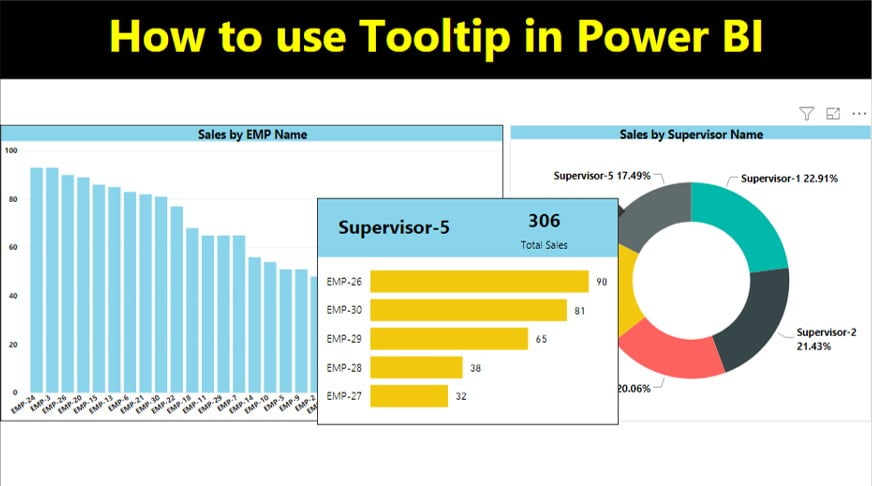
You can display the report page in tooltip also. In the below given example we have created a supervisor wise sales doughnut chart and a tooltip page (Supervisor Tooltip) which shows the sales chart by employees which are coming under respective supervisor Customized Tooltip.
Below are the steps to show the report page as Customized Tooltip
- Add a new page and rename it. (Click on + button available with the sheet tabs)
- Go to the format.
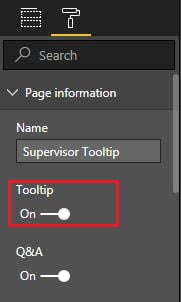
- Enable the Tooltip available in Page Information.
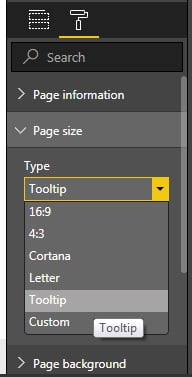
- Select the “Page Size” as “Tooltip”.
- Now design your page as per your requirement.
- Go back to the main page and select the chart or other visual wherein you want to display this Customized Tooltip page.
- Go to the format >> Tooltip
- Select Report Page in Type.
- Select your Tooltip page in Page Dropdown.
- Now if you will hover on your chart then it will show you the tooltip page.
Click here to download the practice file.
Watch the step by step video tutorial:
Visit our YouTube channel to learn step-by-step video tutorials