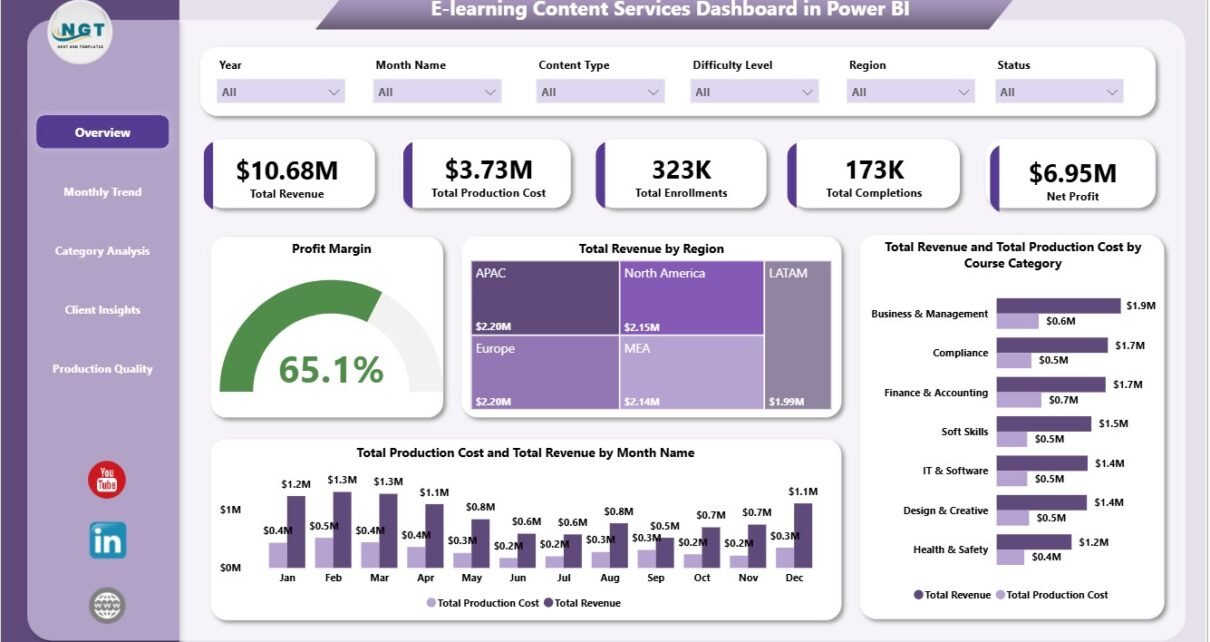
• Advanced Excel
    • Shortcut Keys
    • Useful Formulas
    • Basic Charts
    • Advanced Chart
    • Sort and Filter
    • Pivot Table
    • Data Validation
    • Conditional Formatting
    • Auto Fill and Flash Fill
    • Find and Replace
  • VBA Course
  • Products
    • Restaurant Management
    • PK’s Utility Tool V3.0
    • PK’s Utility Tool V2.0
    • PK’s Utility Tool V1.0
    • Task Management
    • AMS – Lite
    • AMS V1.0
    • AMS V2.0
    • Sale/Purchase Software
    • PK’s Function Kit
  • Blogs
    • Charts and Visualization
    • VBA
    • Excel Tips and Tricks
    • Templates
  • Excel Dashboard
    • Sales Dashboard
    • Process Dashboard
    • Performance Dashboard
    • Project Management
    • Outbound Dashboard
    • Incentive Dashboard
    • Zonal Dashboard in Excel
    • Quick Dashboard
  • Free Templates
  • Power BI
  • About Us
  • Contact Us

PK: An Excel Expert

Transforming Data into Decisions

Tag: Power BI

On object interaction in Power BI
Power BI

Enhance Your Power BI Experience with On-Object Interaction

March 19, 2023March 21, 2023 PKComments Off on Enhance Your Power BI Experience with On-Object Interaction
In this article, we will discover the benefits of using on-object interaction in Power BI, learn how to enable this feature, and understand the limitations and known issues. What is
Read More
3D Glass Chart in Power BI
Power BI

Power BI dashboard with 3D Glass Chart

January 23, 2023March 5, 2023 PKComments Off on Power BI dashboard with 3D Glass Chart
Data visualization is an important part of modern businesses. It helps companies to make decisions based on data-driven insights. Microsoft Power BI is a business intelligence tool Which provides the
Read More
Table in Power BI
Power BI

Table in Power BI

October 4, 2022 PKComments Off on Table in Power BI
Table Visual is used to show the tabular data in Power BI. In this visual you can see the headers of the data and Total in the last row. [caption
Read More
Sparklines in Power BI
Power BI

Sparklines in Power BI

May 17, 2022May 17, 2022 PKComments Off on Sparklines in Power BI
Sparklines are the small charts that can be created in the Table/Matrix cell to show the trend of over the period. We can use the sparklines in the Power BI report also. It
Read More
Profit Analysis using What if Analysis
Power Pivot

Profit Analysis Dashboard using What-if Parameter

April 27, 2022May 10, 2022 PKComments Off on Profit Analysis Dashboard using What-if Parameter
In this article, we have created a Profit Analysis using What-if Parameter in Microsoft Power BI. You can use this trick in your Sales dashboard.   [caption id="attachment_57629" align="alignnone" width="1920"]
Read More
Energy Consumptions Dashboard
Power BI

Energy Consumptions Dashboard in Power BI

March 1, 2022March 1, 2022 PKComments Off on Energy Consumptions Dashboard in Power BI
We have crated this Energy Consumption Dashboard in Microsoft Power BI. We have explained step by step data transformation in Power Query, Creation of the Relationship between fact & dimension
Read More
Time Series Forecast and Anomaly Detection in Power BI
Power BI

Time Series Forecast and Anomaly Detection in Power BI

November 25, 2021November 25, 2021 PKComments Off on Time Series Forecast and Anomaly Detection in Power BI
In this article, we have created the Time Series Forecast and Anomaly Detection in Microsoft Power BI. You can use this for Data Analysis, Sales Forecast, find Outliers in your
Read More
3 Ways to drill through
Power BI

3 Ways to use the Drill Through in Power BI

May 27, 2021May 27, 2021 PKComments Off on 3 Ways to use the Drill Through in Power BI
In this article, you will learn 3 different ways to Drill Through in Power BI. Drill through is used to navigate different pages within the report with the filter of
Read More
Infographics in Power BI
Power BI

Infographics in Power BI dashboard

April 18, 2021May 3, 2021 PKComments Off on Infographics in Power BI dashboard
In this article, you will learn how to use Infographic Designer Visual in Power BI. This Visual can improve the beauty of your Power BI Dashboards. Using this Visual, we
Read More
DSR
Power BI

Daily Sales Report – Data Extraction from multiple PDF files

November 15, 2020November 15, 2020 PKComments Off on Daily Sales Report – Data Extraction from multiple PDF files
In this article, we have created a Daily Sales Report (DSR) in Microsoft Power BI. We have extracted and consolidated the data from multiple PDF files using Power Query. After
Read More

Posts navigation

1 2 3 Next
  • Advanced Excel
    • Shortcut Keys
    • Useful Formulas
    • Basic Charts
    • Advanced Chart
    • Sort and Filter
    • Pivot Table
    • Data Validation
    • Conditional Formatting
    • Auto Fill and Flash Fill
    • Find and Replace
  • VBA Course
  • Products
    • Restaurant Management
    • PK’s Utility Tool V3.0
    • PK’s Utility Tool V2.0
    • PK’s Utility Tool V1.0
    • Task Management
    • AMS – Lite
    • AMS V1.0
    • AMS V2.0
    • Sale/Purchase Software
    • PK’s Function Kit
  • Blogs
    • Charts and Visualization
    • VBA
    • Excel Tips and Tricks
    • Templates
  • Excel Dashboard
    • Sales Dashboard
    • Process Dashboard
    • Performance Dashboard
    • Project Management
    • Outbound Dashboard
    • Incentive Dashboard
    • Zonal Dashboard in Excel
    • Quick Dashboard
  • Free Templates
  • Power BI
  • About Us
  • Contact Us
Copyright © 2023 PK-AnExcelExpert.com - Privacy Policy