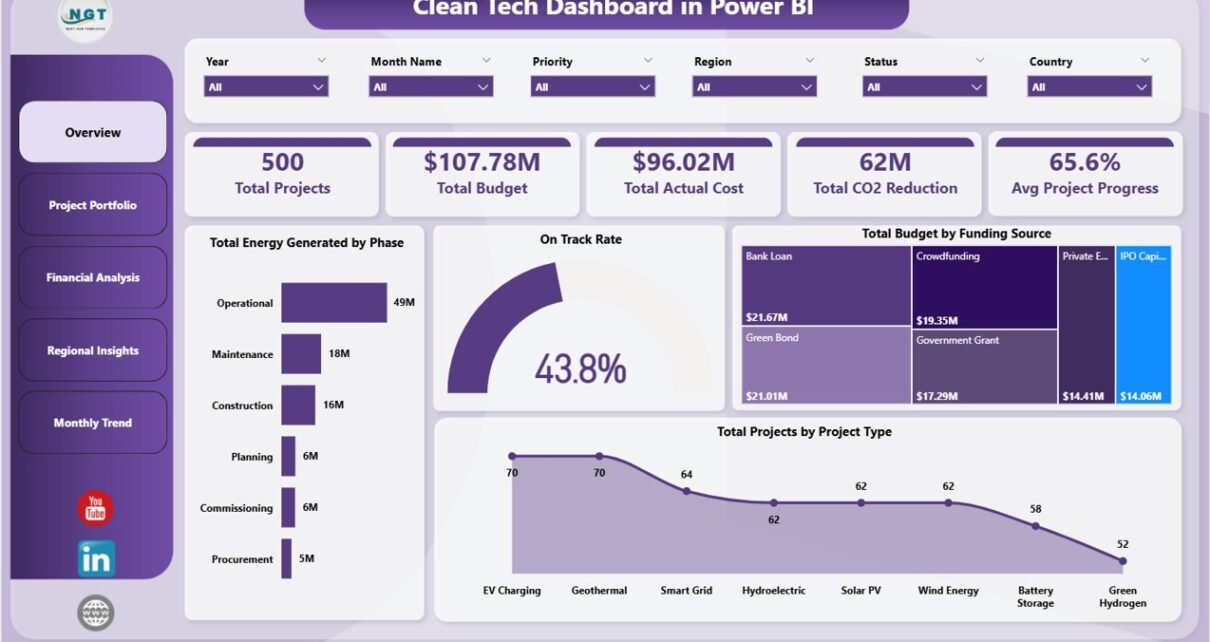
• Advanced Excel
    • Shortcut Keys
    • Useful Formulas
    • Basic Charts
    • Advanced Chart
    • Sort and Filter
    • Pivot Table
    • Data Validation
    • Conditional Formatting
    • Auto Fill and Flash Fill
  • VBA Course
  • Products
    • PK’s Utility Tool V2.0
    • PK’s Utility Tool V1.0
    • Task Management
    • AMS V1.0
    • AMS V2.0
    • Sale/Purchase Software
    • PK’s Function Kit
  • Blogs
    • Charts and Visualization
    • VBA
    • Excel Tips and Tricks
    • Templates
  • Excel Dashboard
    • Sales Dashboard
    • Process Dashboard
    • Performance Dashboard
    • PM Dashboard
    • Outbound Dashboard
    • Incentive Dashboard
    • Zonal Dashboard in Excel
    • Quick Dashboard
  • Power BI
  • About Us
  • Contact Us

PK: An Excel Expert

Online Excel Tutorials

Power BI

DSR
Power BI

Daily Sales Report – Data Extraction from multiple PDF files

November 15, 2020November 15, 2020 PKComments Off on Daily Sales Report – Data Extraction from multiple PDF files
Row Level Security in Power BI
Power BI

Static and Dynamic Row Level Security in Power BI

October 25, 2020October 25, 2020 PKComments Off on Static and Dynamic Row Level Security in Power BI
Quality Analysis Dashboard
Power BI

Quality Analysis Dashboard in Power BI

September 27, 2020September 27, 2020 PKComments Off on Quality Analysis Dashboard in Power BI
BI Dashboard
Power BI

Comparative Analysis Dashboard in Power BI

September 6, 2020September 14, 2020 PKComments Off on Comparative Analysis Dashboard in Power BI
Table view in Excel
Power BI VBA

Custom Toggle Button in Excel and Power BI

August 9, 2020August 9, 2020 PKComments Off on Custom Toggle Button in Excel and Power BI
Northwind Dashboard
Dashboard Power BI

Beautiful Power BI Dashboard with Northwind Database

March 24, 2020June 30, 2020 PKComments Off on Beautiful Power BI Dashboard with Northwind Database
AI Based Visual in Power BI
Power BI

Artificial Intelligence based visuals in Power BI

March 15, 2020March 16, 2020 PKComments Off on Artificial Intelligence based visuals in Power BI
Dynamic Conditional Formatting in Power BI
Power BI

Dynamic Conditional Formatting in Power BI

December 26, 2019December 26, 2019 PKComments Off on Dynamic Conditional Formatting in Power BI
Liquid fill Gauge Chart
Power BI

Custom Visual: Liquid Fill Gauge in Power BI

June 10, 2019June 10, 2019 PKComments Off on Custom Visual: Liquid Fill Gauge in Power BI
Sales Dashboard in Power BI
Power BI

Design, Publish and Share a Sales Dashboard in Power BI

May 22, 2019May 22, 2019 PKComments Off on Design, Publish and Share a Sales Dashboard in Power BI

Posts navigation

1 2 Next

Top Categories

  • Charts and Visualization (102)
  • Dashboard (5)
  • Excel Tips and Tricks (35)
  • Power BI (12)
  • Power Pivot (11)
  • Power Point Visualization (4)
  • Predictive Analytics (3)
  • Templates (31)
  • VBA (61)

Read More about..

  • Advanced Excel
  • VBA Course
  • Dashboard
  • Chart and Visualization
  • VBA Tips
  • Excel Tips and Trics
  • Our Excel Products
  • About US
  • Contact Us


Subscribe to our Newsletter


Download Free Dashboards

  • Project Management Dashboard
  • Zonal Dashboard
  • Sales Dashboard
  • Outbound Dashboard
  • A Quick Dashboard
  • C-SAT Dashboard
  • Performance Dashboard
  • Process Dashboard
  • Incentive Dashboard

Recent Posts

  • Annual Leave Tracker with Daily/Monthly View in Excel
  • Stylish Attendance Tracker with Symbols
  • Transport Cost Optimization Using Solver in Excel
  • What-If Analysis (Goal Seek, Scenario Manager and Data Table) in Excel
  • Dynamic Pivot Table with Multiple Tables using Power Query
  • Vertical and Circular Bullet Chart in Excel
  • Inventory Management Template for Store
  • 10 Pro Tips for Excel Charts
  • Dynamic Hourly Project Planner (Gantt Chart)
  • Price Fetching Tool from Amazon and Flipkart
Copyright © 2018 PK-AnExcelExpert.com - Privacy Policy