Customs Clearance Agencies Dashboard in Power BI gives customs brokers, freight forwarders, import-export teams, compliance leaders, and brokerage managers a practical reporting template for monitoring clearance performance. Customs operations often involve shipment values, duty amounts, service fees, penalties, case status, risk levels, country lanes, ports, brokers, clients, and commodities. When these details are spread across spreadsheets, emails, and operational systems, managers lose time during daily reviews.
This Power BI dashboard brings those moving parts into 5 focused report pages: Overview, Clearance Trend, Port Analysis, Risk Compliance, and Client Brokerage. It is built for teams that want faster visibility without starting a Power BI report from a blank canvas.
Customs Clearance Agencies Dashboard in Power BI
Key Features of Customs Clearance Agencies Dashboard in Power BI
- 5 dashboard pages: Analyze overview metrics, trend movement, port activity, compliance risk, and client-broker performance.
- High-level KPI cards: Track Total Shipment Value, Total Service Fee, Total Penalty Amount, Total Duty Amount, and Total Cases.
- Multiple slicers: Filter the dashboard quickly by practical customs fields such as status, risk level, country lane, port, shipment mode, client type, broker, commodity group, and month.
- Power BI format: Use an editable PBIX file in Power BI Desktop and adapt visuals, data model fields, measures, and report styling.
- Operational storytelling: Move from executive summary to trends, ports, risk, and brokerage workload without rebuilding the report structure.
Dashboard Pages Explanation
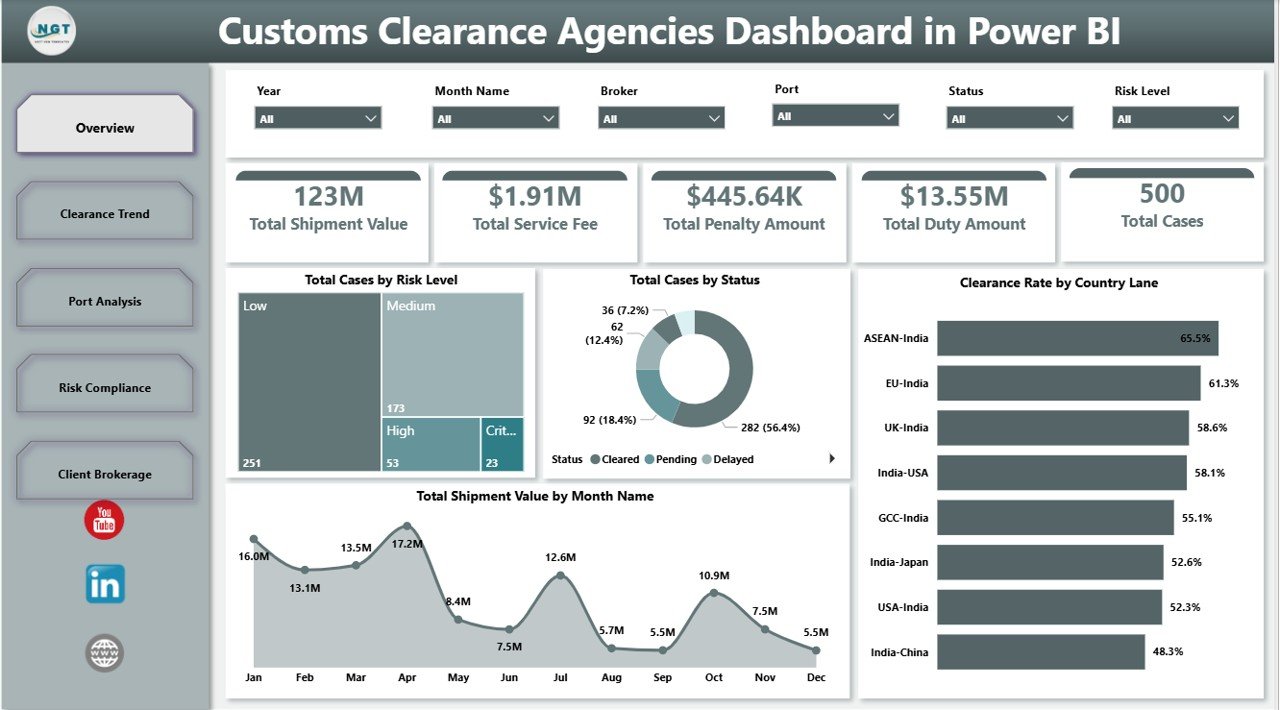
1. Overview Page
The Overview page is designed for quick leadership review. At the top of the sheet, KPI cards show Total Shipment Value, Total Service Fee, Total Penalty Amount, Total Duty Amount, and Total Cases, giving managers a fast read on financial value, cost exposure, and workload volume.
Total Cases by Risk Level explains how clearance cases are distributed across risk categories. This helps compliance teams see whether high-risk work is increasing and where review effort should be directed.
Total Cases by Status shows workload by process stage. It makes pending, delayed, rejected, in-review, or cleared cases easier to discuss in daily operations meetings.
Clearance Rate by Country Lane compares performance across import-export lanes. Use it to identify lanes where documentation, inspections, or regulatory processes are slowing down clearance.
Total Shipment Value by Month Name shows how shipment value changes month by month. Finance and operations teams can compare seasonal value patterns against duties, fees, penalties, and case counts.
2. Clearance Trend
The Clearance Trend page focuses on time-based performance. Total Shipment Value by Quarter helps managers review quarterly movement, Avg Clearance Time by Status identifies bottlenecks by workflow stage, and Total Cases by Month Name shows how case volume changes through the year.
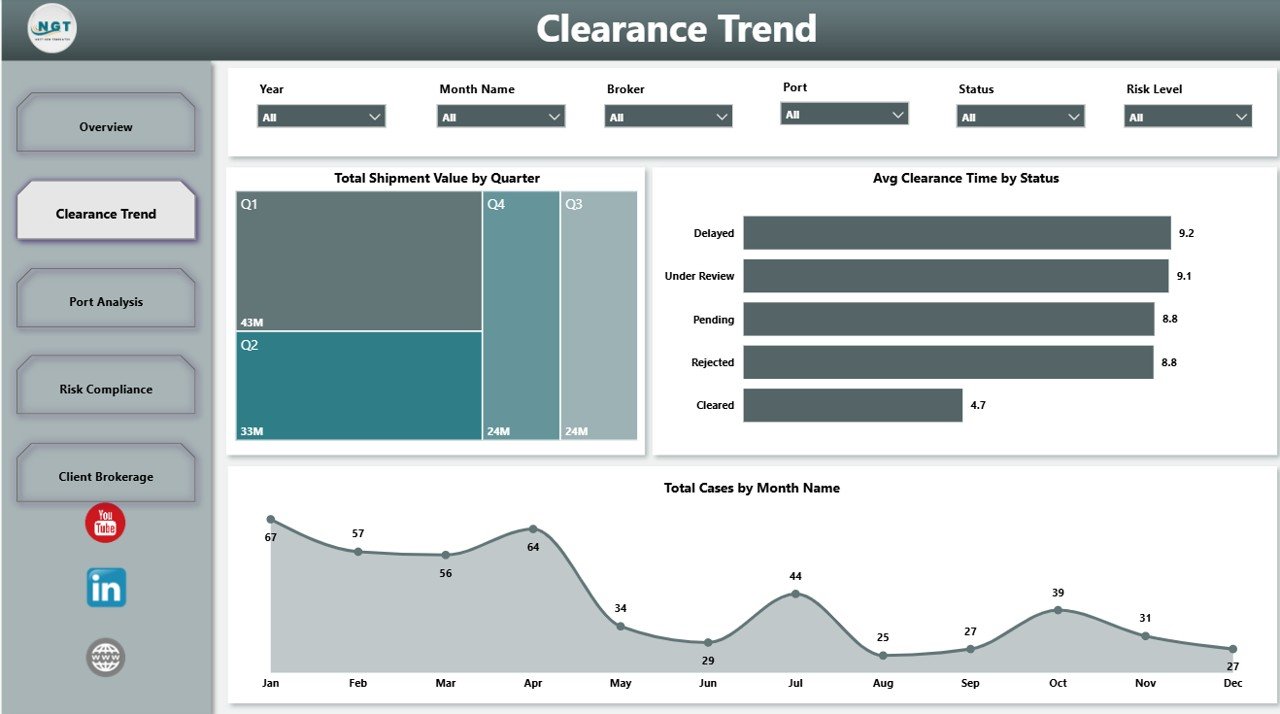
Clearance Trend
3. Port Analysis
The Port Analysis page helps teams compare activity across ports, shipment modes, and country lanes. Total Shipment Value by Port reveals where commercial value is concentrated, Total Cases by Shipment Mode shows workload by transport method, and Avg Clearance Time by Country Lane supports lane-level process improvement.
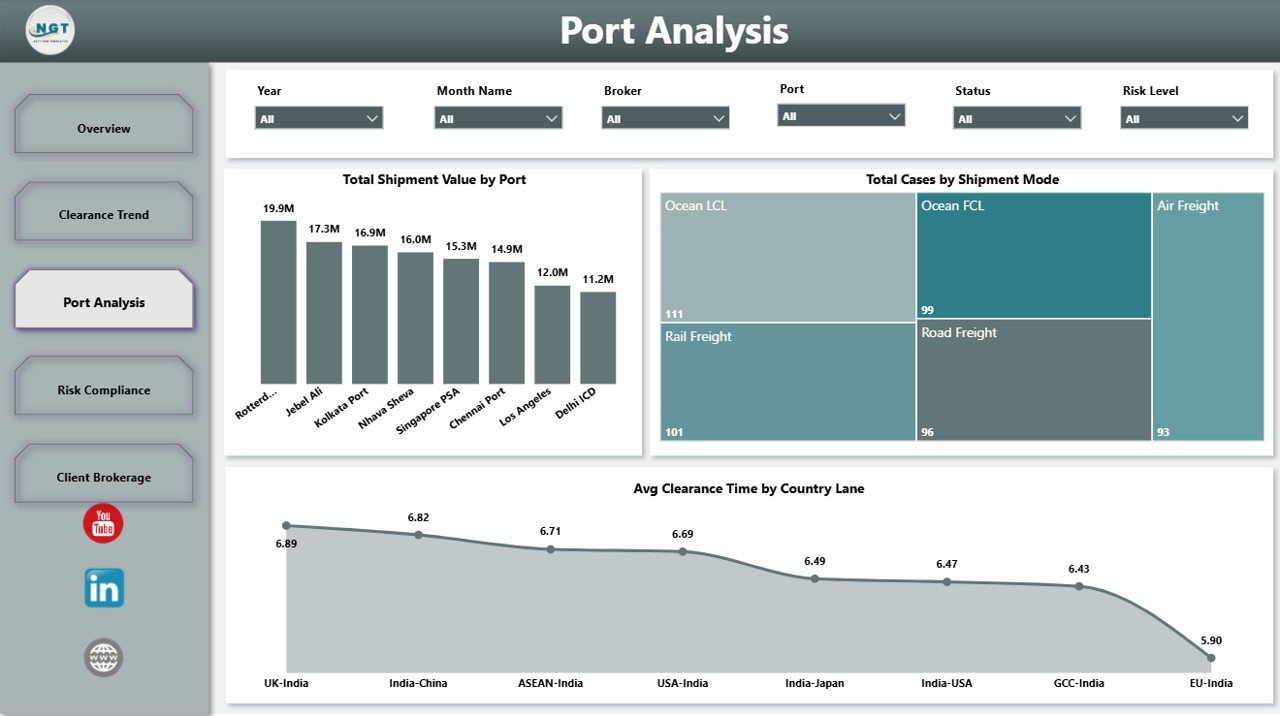
Port Analysis
4. Risk Compliance
The Risk Compliance page highlights where the team should focus attention before penalties grow. Pending Cases by Risk Level shows open workload by risk category, Total Penalty Amount by Entry Type identifies expensive entry patterns, and Total Penalty Amount by Commodity Group reveals commodity categories that need closer review.
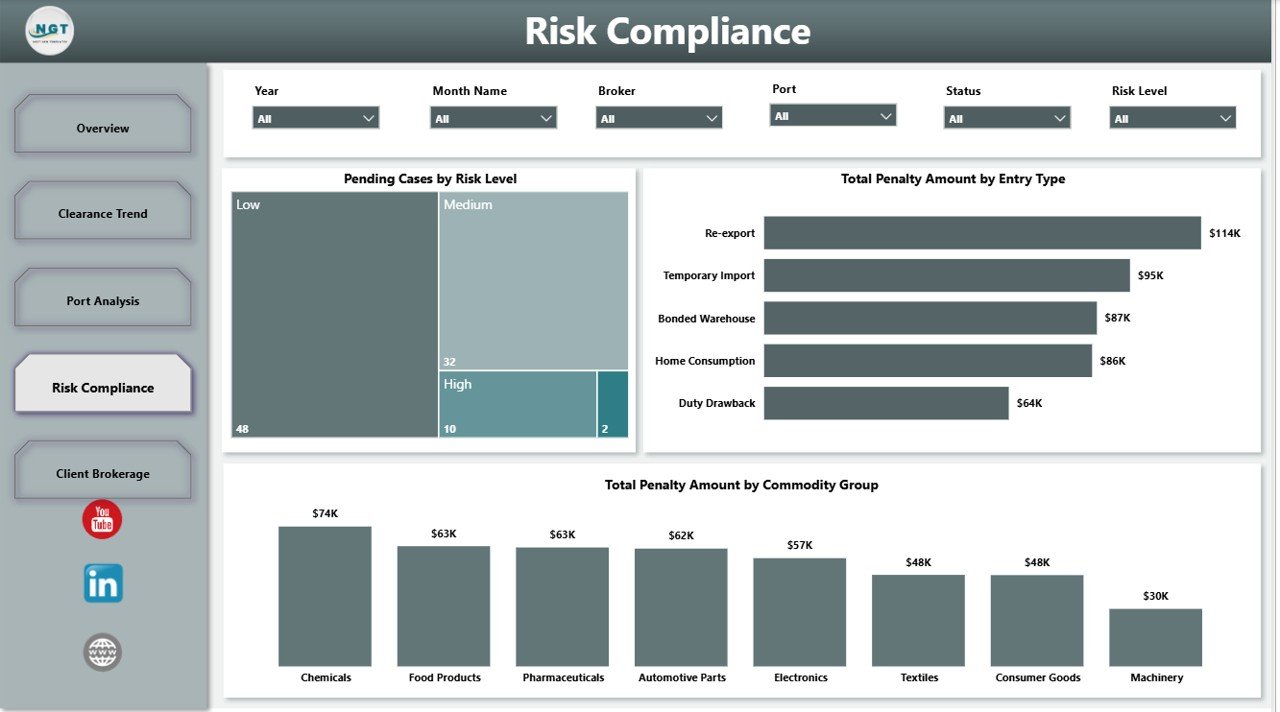
Risk Compliance
5. Client Brokerage
The Client Brokerage page connects client value, commodity complexity, and broker workload. Total Shipment Value by Client Type shows which client groups drive value, Avg Clearance Time by Commodity Group reveals slower-moving commodity categories, and Total Cases by Broker helps managers compare assigned workload.
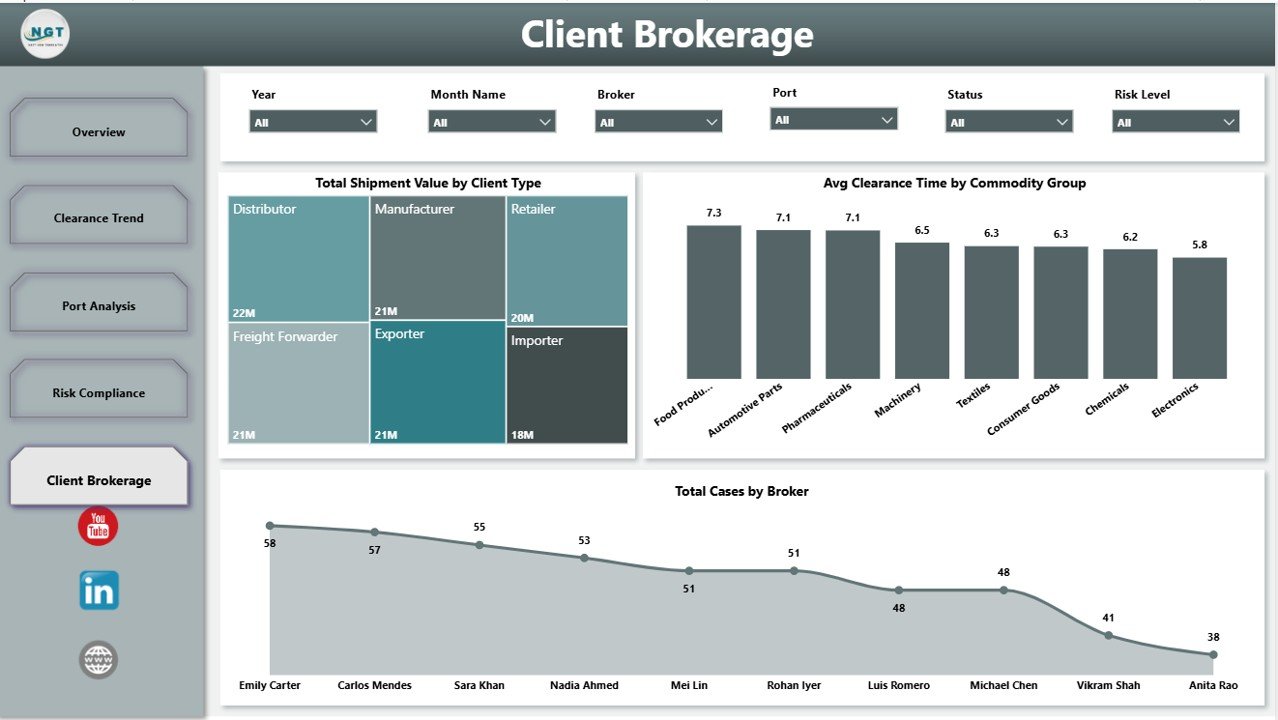
Client Brokerage
Customs Clearance Agencies Dashboard in Power BI vs. Tableau vs. Paid Logistics SaaS – Feature Comparison
| Feature | This Power BI Template | Tableau Alternative | Paid Logistics SaaS |
|---|---|---|---|
| Cost | $17.99 one-time template purchase | License cost may apply | Usually recurring subscription |
| Platform | Power BI Desktop and Power BI Service | Tableau Desktop or Cloud | Vendor-hosted platform |
| Setup time | Open PBIX, connect data, refresh | Build or adapt workbook | Implementation and onboarding |
| Real-time team collaboration | Available when published to Power BI Service | Available through Tableau Cloud/Server | Usually included |
| Mobile access | Available through Power BI apps after publishing | Available through Tableau mobile options | Usually included |
| Customizable fields | Editable visuals, fields, and measures | Editable with Tableau skills | Depends on vendor plan |
| Share with link | Yes, subject to Power BI permissions | Yes, subject to Tableau permissions | Usually yes |
| Year-1 cost at 5 users | $17.99 plus any Microsoft licensing already used | Often higher for paid seats | Often hundreds or thousands of dollars |
| Customs metrics | Pre-built for cases, shipment value, duties, fees, penalties, risks, ports, lanes, clients, and brokers | Manual setup needed | May require vendor configuration |
Who Should Use This Template
This template is a good fit for customs clearance agencies, customs brokers, freight forwarding teams, import-export teams, logistics analysts, finance reviewers, and trade compliance managers who already use or plan to use Power BI for reporting.
It is also useful for consultants who build reporting packs for logistics clients and need a clean starting structure. It is not intended to replace customs filing software, shipment tracking APIs, EDI connections, or live government portals.
Real-World Use Cases
Brokerage operations review: A brokerage manager can use Total Cases by Status and Pending Cases by Risk Level to decide which cases need urgent follow-up before client escalation.
Compliance coaching: A compliance lead can review penalty amount by entry type and commodity group to find patterns that require documentation training or tariff classification review.
Finance and client reporting: A finance analyst can compare shipment value by month, quarter, port, and client type to explain performance during monthly management reviews.
Advantages of Customs Clearance Agencies Dashboard in Power BI
The main advantage is speed. Instead of designing a data model, layout, KPIs, slicers, and visuals from scratch, you start with a customs-focused structure. The report already separates executive overview, trends, port performance, risk, and client brokerage analysis.
Power BI also gives teams room to grow. You can connect Excel, CSV, databases, SharePoint files, or other supported sources, then publish the report when your team needs scheduled refresh or controlled sharing. Microsoft provides detailed documentation for connecting to data in Power BI Desktop.
Opportunities for Improvement
Like any template, this dashboard works best when your source data is clean and consistent. Teams should standardize status names, risk levels, country lanes, ports, shipment modes, brokers, client types, commodity groups, and date fields before connecting their data.
Advanced users may also add more DAX measures, row-level security, scheduled refresh, or drill-through pages based on their operational process. If your organization needs live filing or system integration, this dashboard should sit beside those systems as an analytics layer.
Best Practices
- Keep one consistent case ID for every customs clearance record.
- Use standardized names for ports, brokers, clients, commodity groups, and country lanes.
- Review pending high-risk cases daily instead of waiting for month-end reporting.
- Track penalty amount separately from duty amount and service fee.
- Publish to Power BI Service only after reviewing permissions and data sensitivity.
Explore Relevant Templates
You can get the product here: Customs Clearance Agencies Dashboard in Power BI. You may also like Customs Clearance Agencies Dashboard in Excel, Cross-border Trade Services Dashboard in Excel, and more Power BI Dashboard Templates.
Frequently Asked Questions
What software do I need?
You need Microsoft Power BI Desktop to open and edit the PBIX file. Power BI Service is optional for publishing and sharing.
Can I use my own customs data?
Yes. Replace or connect the sample data with your own customs clearance records and map the required fields.
Does the template include multiple pages?
Yes. It includes Overview, Clearance Trend, Port Analysis, Risk Compliance, and Client Brokerage pages.
Can I change the charts?
Yes. The PBIX file is editable, so you can change visuals, colors, labels, measures, and filters.
Is this dashboard a customs filing system?
No. It is an analytics dashboard for reporting and review. It does not submit declarations or connect directly to customs authorities.
Is this a one-time purchase?
Yes. The template is sold as a one-time purchase. Any Microsoft licensing for cloud sharing is separate.
About the Author
Built by PK – Microsoft Certified Professional with 15+ years of Excel, Google Sheets, and Power BI experience. Founder of NextGenTemplates, reaching 300K+ subscribers across YouTube channels. Every template is hand-built and tested before release.
Conclusion
The Customs Clearance Agencies Dashboard in Power BI gives customs and logistics teams a focused way to review shipment value, duty amount, service fees, penalties, case status, risk levels, country lanes, ports, clients, commodities, and broker workload. It is a practical starting point for teams that want better reporting without building a Power BI dashboard from scratch.
For more tutorials, visit PK: An Excel Expert on YouTube.
Customs Clearance Agencies Dashboard in Power BI