New: NextGenTemplates Academy - video courses on Excel formulas with AI and Pivot Tables & dashboards. Early-bird: 20% off with code EARLYBIRD20 - first 20 orders only. See the courses →
  • Learn Excel (Free Course)
    • 1. Shortcut Keys
    • 2. Fill & Flash Fill
    • 3. Find & Replace
    • 4. Sort & Filter
    • 5. Formulas & Functions
    • 6. Data Validation
    • 7. Conditional Formatting
    • 8. Basic Charts
    • 9. Advanced Charts
    • 10. Pivot Tables
    • 11. Excel Dashboards
    • 12. VBA Course
    • 13. Excel Formulas with AI
  • Templates
  • Tutorials
    • Charts and Visualization
    • VBA
    • Excel Tips and Tricks
    • Excel Dashboards
    • Power Pivot & DAX
  • Power BI
  • Template Store
    • Ready to Use Templates
  • Courses
  • Academy
    • Excel + AI Mastery: 100 Formulas
    • Excel Pivot Tables & Dashboards
  • About Us
  • Contact Us

PK: An Excel Expert

Transforming Data into Decisions

Tag: Power BI KPI Dashboard

Dashboard Power BI Templates

Lawn Care Business KPI Dashboard in Power BI

September 23, 2026September 23, 2026 PKComments Off on Lawn Care Business KPI Dashboard in Power BI
The Lawn Care Business KPI Dashboard in Power BI puts 13 lawn care metrics on a single monthly scorecard, spread across 4 report pages and 5 KPI groups: Cost Control,
Read More
Power BI Templates

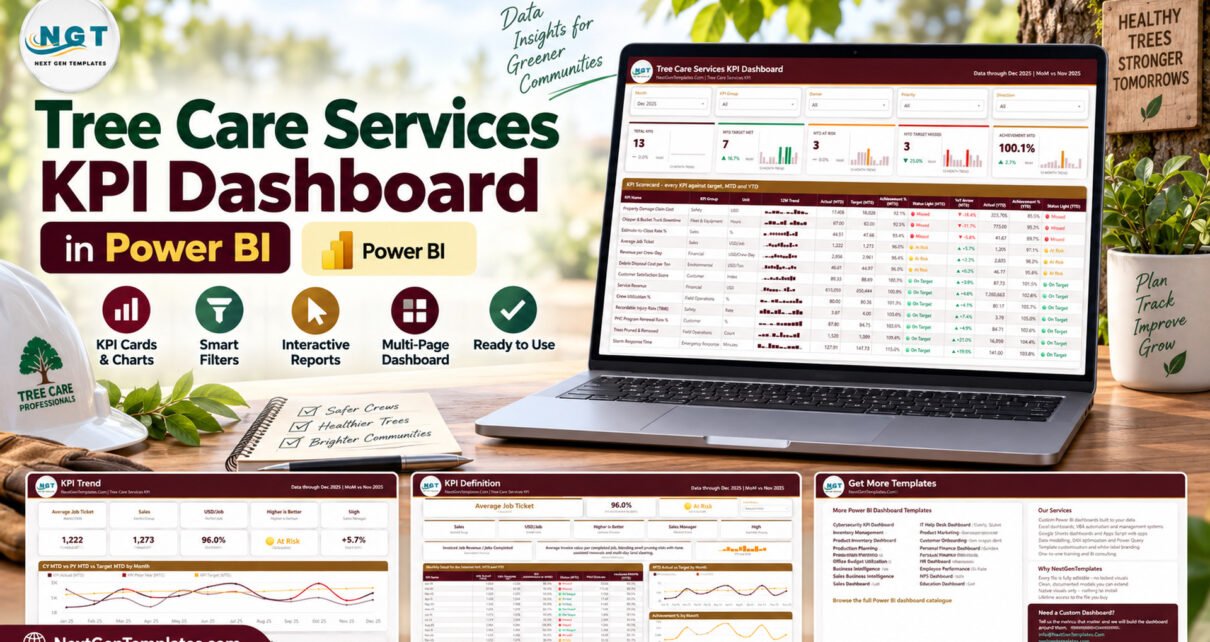
Tree Care Services KPI Dashboard in Power BI

September 23, 2026September 23, 2026 PKComments Off on Tree Care Services KPI Dashboard in Power BI
Thirteen KPIs, five slicers and twelve months of context can make a tree-service review much easier to navigate. The Tree Care Services KPI Dashboard in Power BI is a ready-to-use
Read More
Power BI Templates

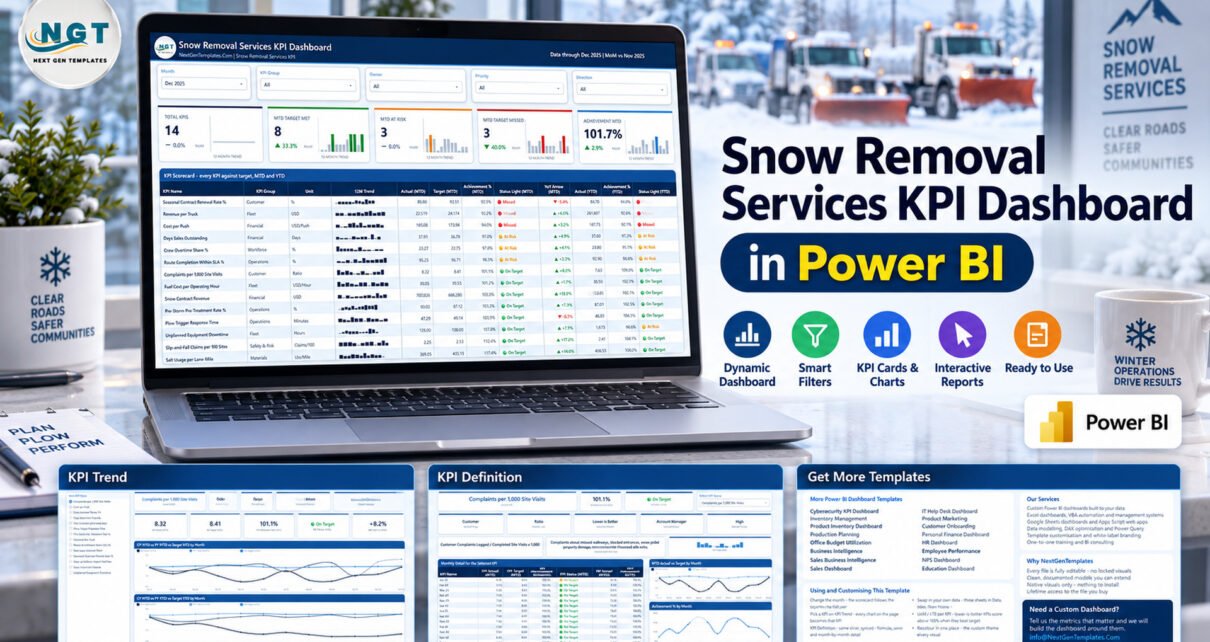
Snow Removal Services KPI Dashboard in Power BI

September 23, 2026September 23, 2026 PKComments Off on Snow Removal Services KPI Dashboard in Power BI
Snow Removal Services KPI Dashboard in Power BI gives winter-operations teams one place to review 14 KPIs across operations, fleet, finance, customer service, workforce, safety, and materials. Instead of reading
Read More
Power BI Templates

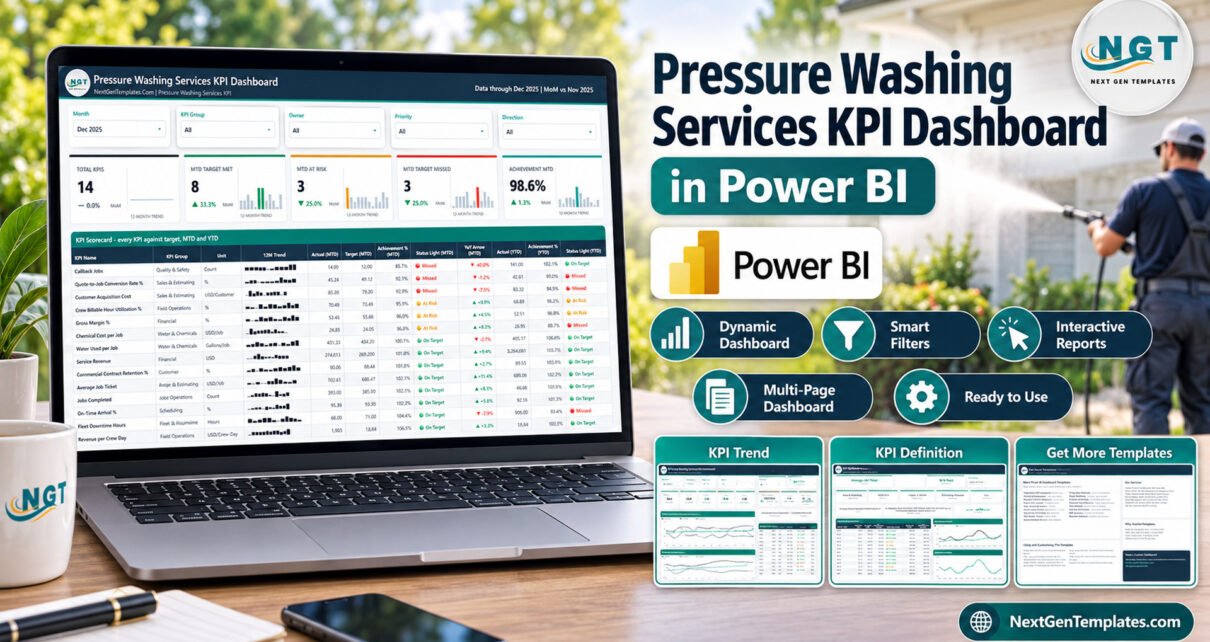
Pressure Washing Services KPI Dashboard in Power BI

September 23, 2026September 23, 2026 PKComments Off on Pressure Washing Services KPI Dashboard in Power BI
The Pressure Washing Services KPI Dashboard in Power BI gives a pressure washing or soft washing company one monthly scorecard for 14 KPIs in 8 groups, with MTD and YTD
Read More
Power BI Templates

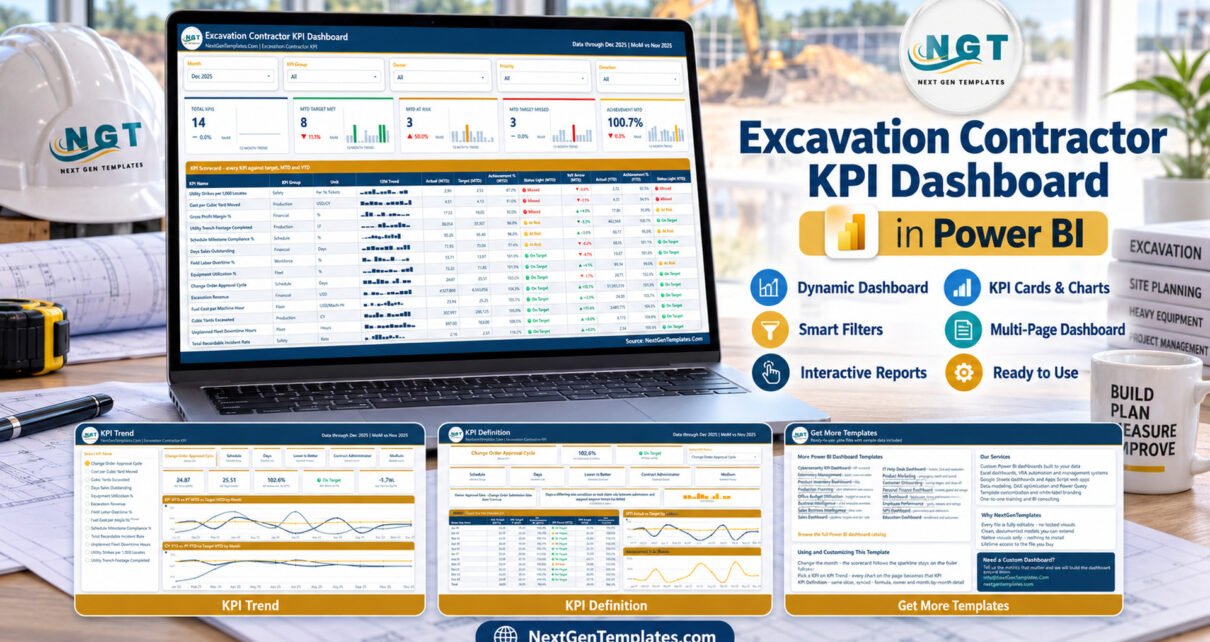
Excavation Contractor KPI Dashboard in Power BI

September 21, 2026September 21, 2026 PKComments Off on Excavation Contractor KPI Dashboard in Power BI
The Excavation Contractor KPI Dashboard in Power BI scores 14 KPIs across 6 KPI groups on four report pages, backed by two hidden tooltip pages and five slicers. Every KPI
Read More
Power BI Templates

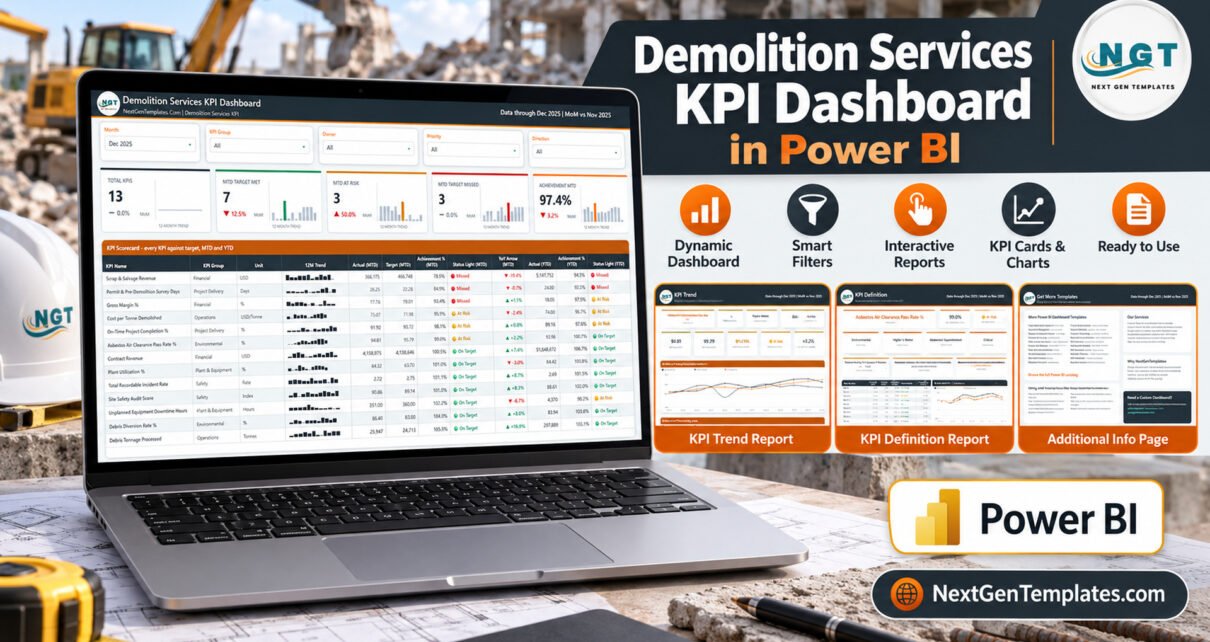
Demolition Services KPI Dashboard in Power BI

September 21, 2026September 21, 2026 PKComments Off on Demolition Services KPI Dashboard in Power BI
The Demolition Services KPI Dashboard in Power BI gives a demolition contractor one monthly scorecard for 13 KPIs in 6 groups, with MTD and YTD traffic lights, a 12-month trend
Read More
Power BI Templates

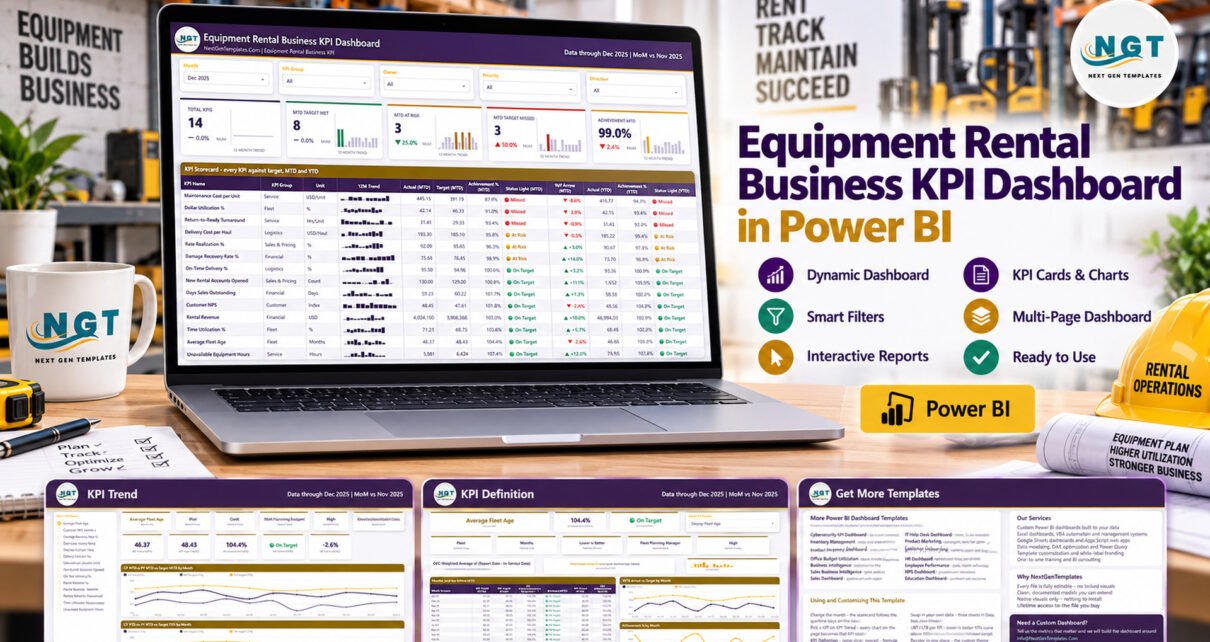
Equipment Rental Business KPI Dashboard in Power BI

September 19, 2026September 19, 2026 PKComments Off on Equipment Rental Business KPI Dashboard in Power BI
The Equipment Rental Business KPI Dashboard in Power BI is a 4-page report that scores 14 rental KPIs across 6 KPI groups every month. It shows MTD and YTD traffic
Read More
Power BI Templates

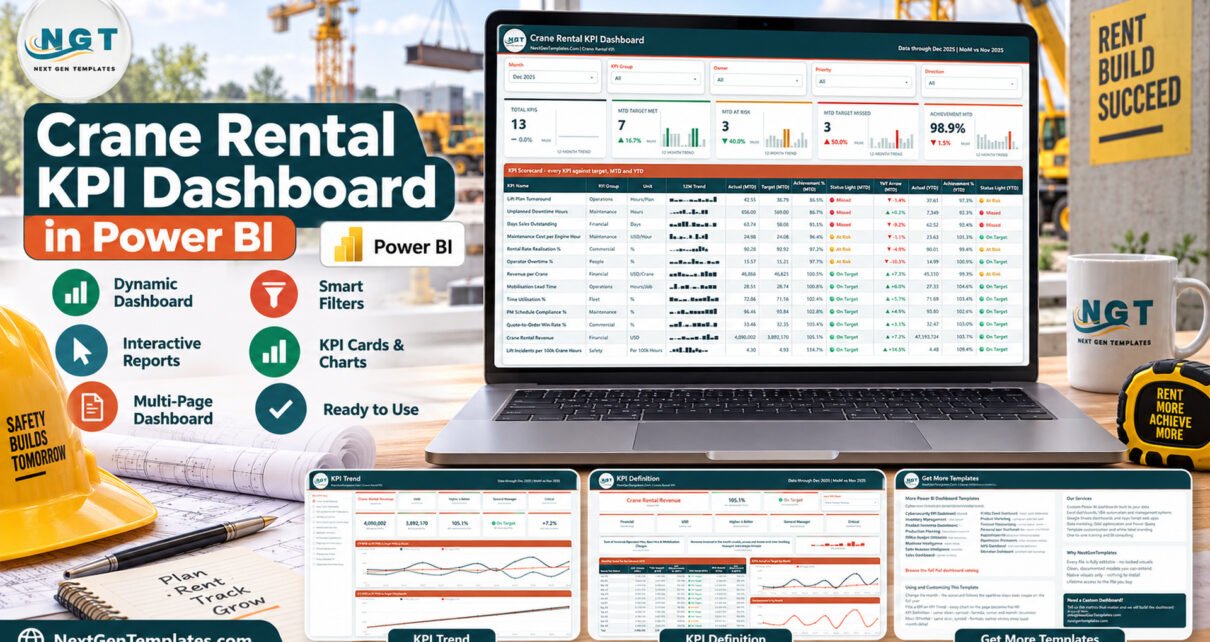
Crane Rental KPI Dashboard in Power BI

September 18, 2026September 18, 2026 PKComments Off on Crane Rental KPI Dashboard in Power BI
The Crane Rental KPI Dashboard in Power BI scores 13 KPIs across 7 KPI groups on four report pages, backed by two hidden tooltip pages and five slicers. Every KPI
Read More
Power BI Templates

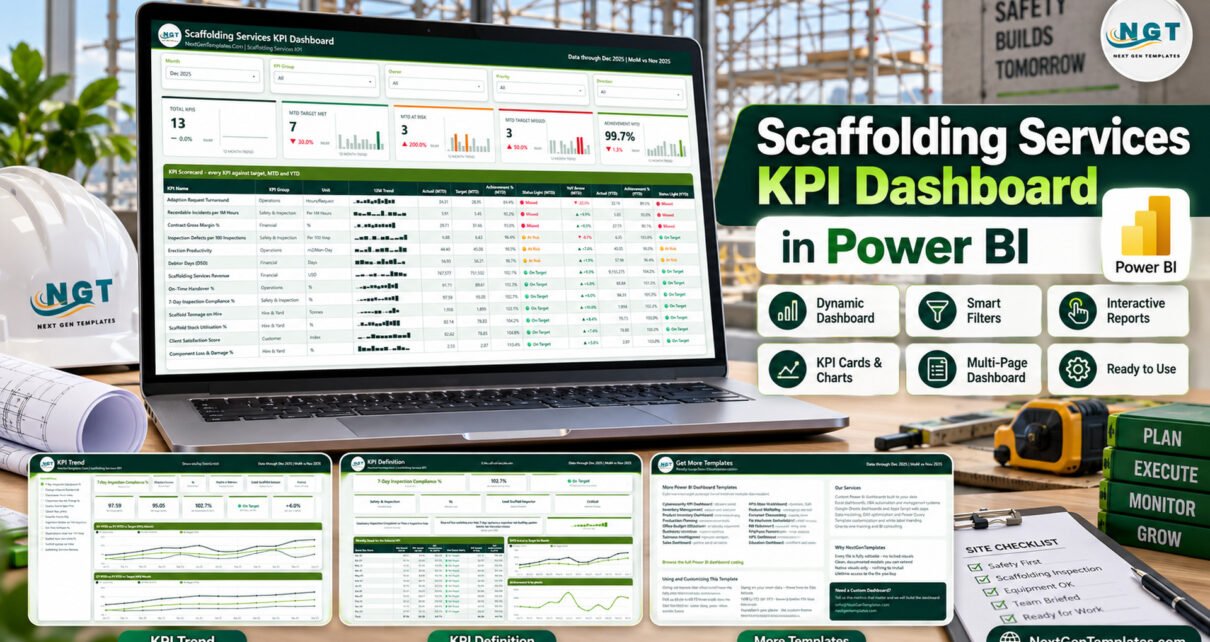
Scaffolding Services KPI Dashboard in Power BI

September 16, 2026September 16, 2026 PKComments Off on Scaffolding Services KPI Dashboard in Power BI
The Scaffolding Services KPI Dashboard in Power BI gives a scaffolding contractor one monthly scorecard for 13 KPIs in 5 groups, with MTD and YTD traffic lights, a 12-month sparkline
Read More
Power BI Templates

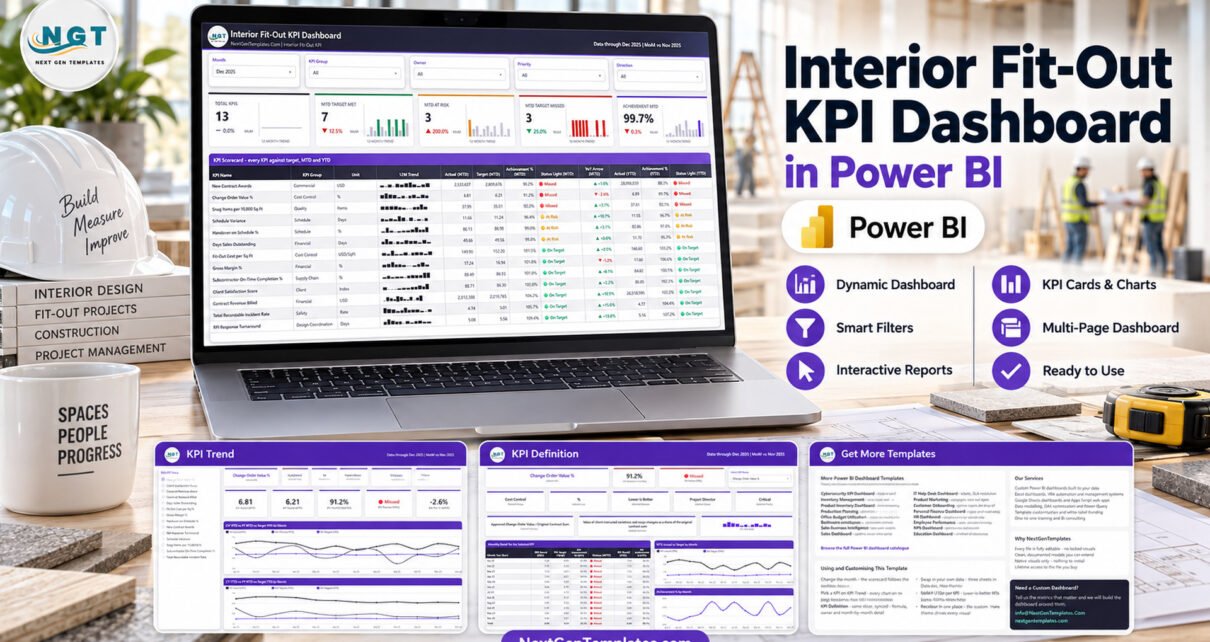
Interior Fit-Out KPI Dashboard in Power BI

September 16, 2026September 16, 2026 PKComments Off on Interior Fit-Out KPI Dashboard in Power BI
The Interior Fit-Out KPI Dashboard in Power BI scores 13 fit-out KPIs across 9 KPI groups on 4 report pages. Every KPI is measured against a monthly target, with MTD
Read More

Posts pagination

1 2 … 15 Next
  • Learn Excel (Free Course)
    • 1. Shortcut Keys
    • 2. Fill & Flash Fill
    • 3. Find & Replace
    • 4. Sort & Filter
    • 5. Formulas & Functions
    • 6. Data Validation
    • 7. Conditional Formatting
    • 8. Basic Charts
    • 9. Advanced Charts
    • 10. Pivot Tables
    • 11. Excel Dashboards
    • 12. VBA Course
    • 13. Excel Formulas with AI
  • Templates
  • Tutorials
    • Charts and Visualization
    • VBA
    • Excel Tips and Tricks
    • Excel Dashboards
    • Power Pivot & DAX
  • Power BI
  • Template Store
    • Ready to Use Templates
  • Courses
  • Academy
    • Excel + AI Mastery: 100 Formulas
    • Excel Pivot Tables & Dashboards
  • About Us
  • Contact Us
Copyright © 2023 PK-AnExcelExpert.com - Privacy Policy