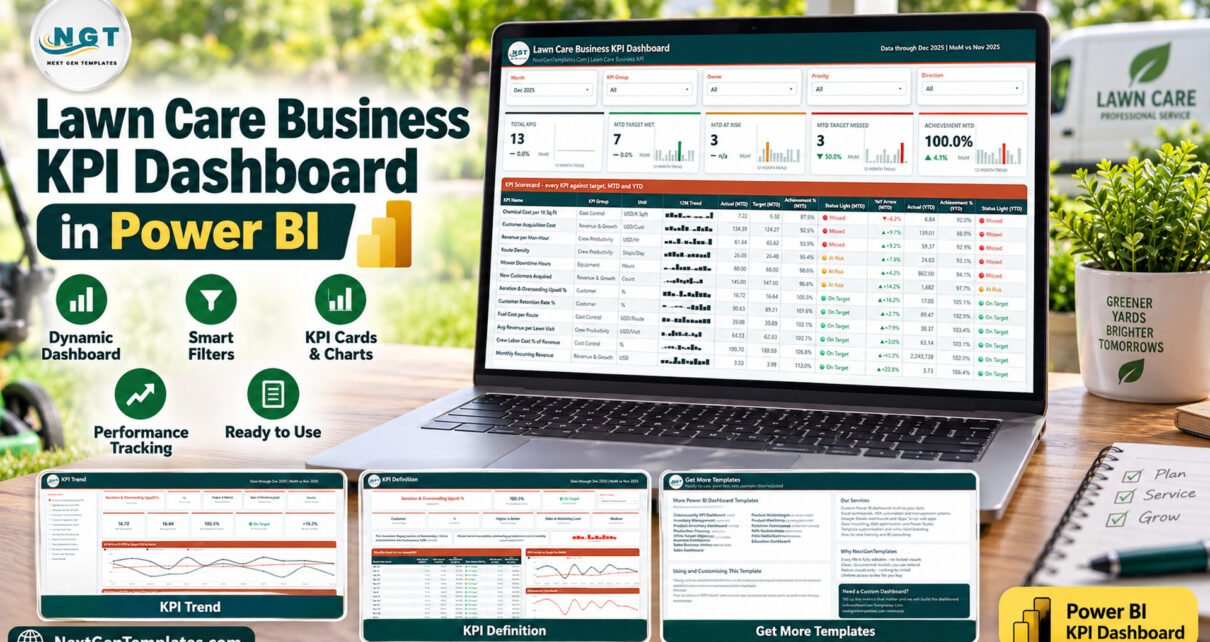
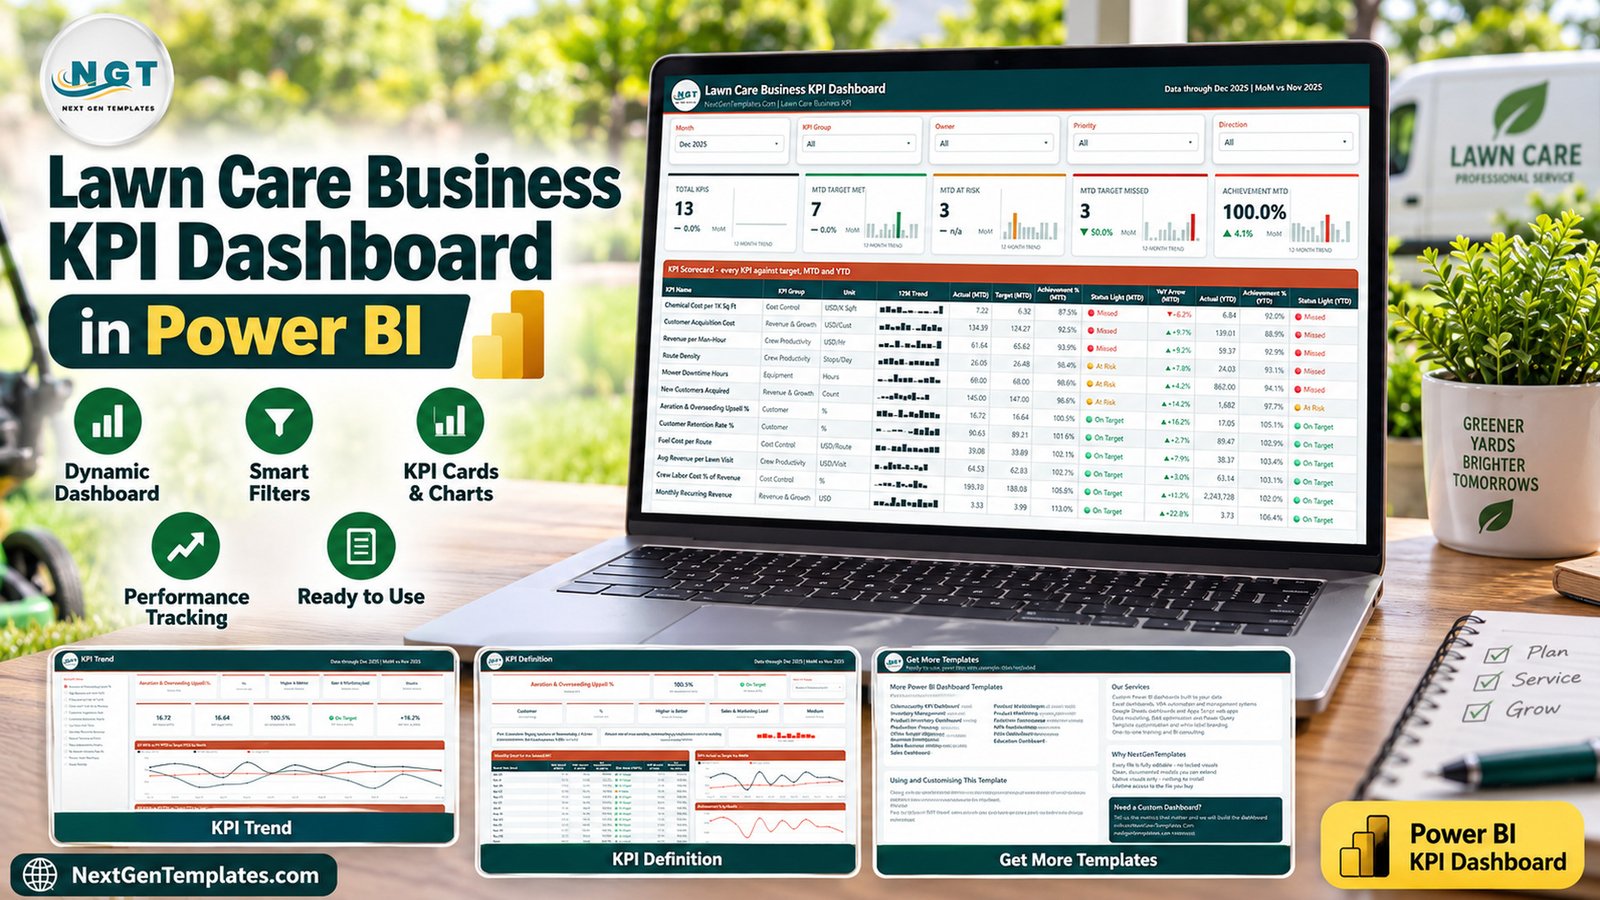
The Lawn Care Business KPI Dashboard in Power BI puts 13 lawn care metrics on a single monthly scorecard, spread across 4 report pages and 5 KPI groups: Cost Control, Revenue & Growth, Crew Productivity, Equipment and Customer. Five slicers — Month, KPI Group, Owner, Priority and Direction — drive every visual on the page. In the sample data shipped with the file, December 2025 closes with 7 KPIs on target, 3 at risk and 3 missed, and an overall MTD achievement of 100.0%.
Most lawn care operators already have the numbers. What they do not have is one page that says, every month, which of those numbers hit target and which slipped — with last year sitting beside this year so a seasonal dip is not mistaken for a problem. Route Density looks healthy in isolation; it looks different when the scorecard shows it at 98.4% of target for the month and only 93.1% for the year to date. That is the gap this template closes.
Key Features of the Lawn Care Business KPI Dashboard in Power BI
13 KPIs with targets, owners and definitions. Chemical Cost per 1K Sq Ft, Customer Acquisition Cost, Revenue per Man-Hour, Route Density, Mower Downtime Hours, New Customers Acquired, Aeration & Overseeding Upsell %, Customer Retention Rate %, Fuel Cost per Route, Avg Revenue per Lawn Visit, Crew Labor Cost % of Revenue, Monthly Recurring Revenue and Re-Service Callback Rate %. Every one carries its own unit, KPI group, owner, priority and direction.
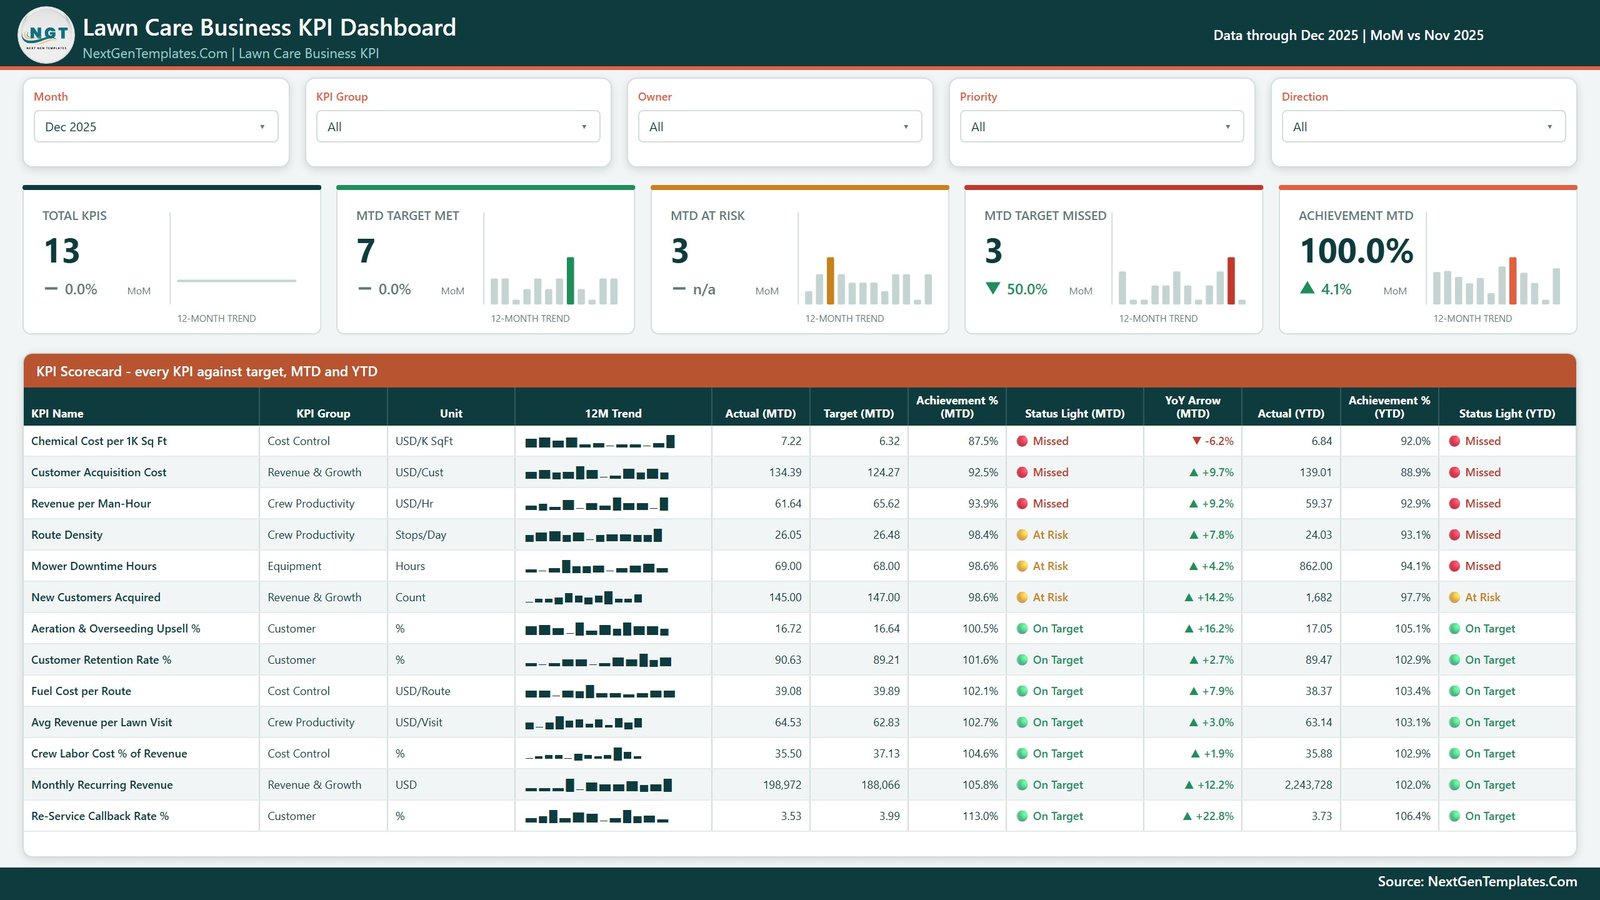
Two traffic lights per KPI, not one. The scorecard shows a Status Light (MTD) and a Status Light (YTD) side by side. In the sample data Route Density reads At Risk for the month but Missed for the year — exactly the kind of divergence a single-status dashboard hides.
Direction-aware achievement. Each KPI is flagged Higher is Better or Lower is Better, and the achievement calculation inverts for lower-is-better metrics. Fuel Cost per Route at 39.08 against a 39.89 target scores 102.1%, not 98%. Nobody has to remember which columns to read backwards.
- Year-on-year arrows — a YoY Arrow (MTD) column with the percentage move against the same month last year, on all 13 rows
- 12-month sparklines — on the five header cards and in the 12M Trend column, holding the full year even when the scorecard is filtered to one month
- Five synced slicers — filter by Month, KPI Group, Owner, Priority or Direction and every visual follows
- A theme file, not hard-coded colours — recolour once and all four pages change
- Native Power BI visuals only — nothing to install from AppSource, no custom-visual licence
- A user manual in the box — the ZIP holds the .pbix, Data.xlsx and a Power BI Dashboard user manual PDF
Dashboard Pages Explanation
Page 1: Lawn Care Business KPI Dashboard
The monthly scorecard page. Five slicers run across the top, then five header cards — Total KPIs, MTD Target Met, MTD At Risk, MTD Target Missed and Achievement MTD — each showing a MoM change and a 12-month trend sparkline. Beneath them the KPI Scorecard table lists all 13 KPIs with KPI Group, Unit, 12M Trend, Actual (MTD), Target (MTD), Achievement % (MTD), Status Light (MTD), YoY Arrow (MTD), Actual (YTD), Achievement % (YTD) and Status Light (YTD).
Page 2: KPI Trend
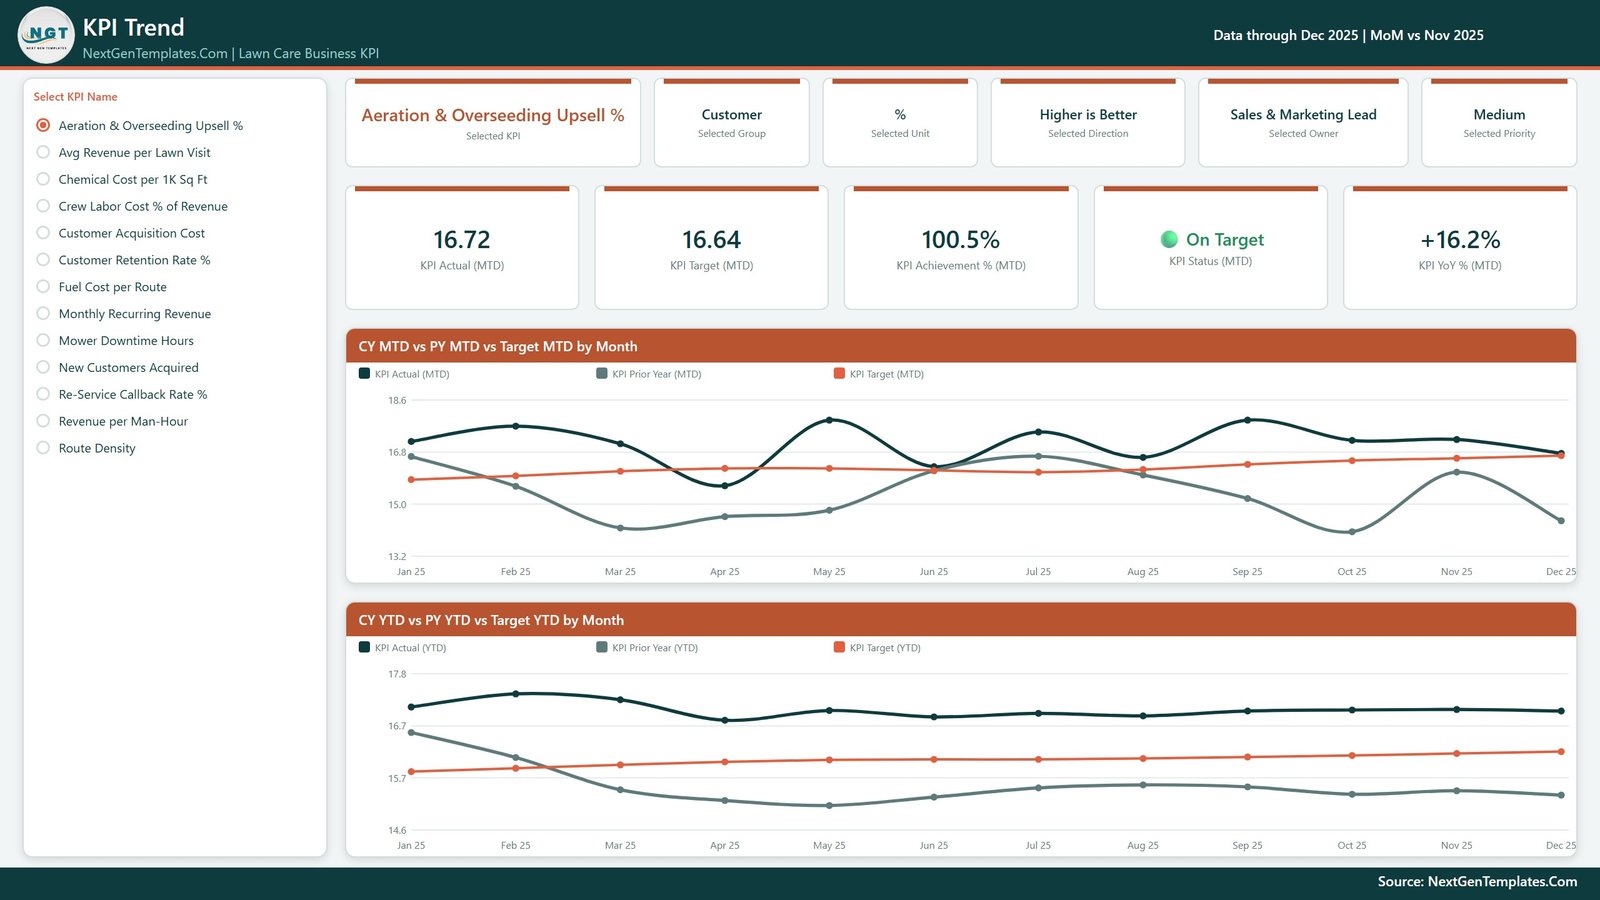
Select one KPI from the radio list on the left and the entire page re-points to it. Six context cards report Selected KPI, Selected Group, Selected Unit, Selected Direction, Selected Owner and Selected Priority; five value cards report KPI Actual (MTD), KPI Target (MTD), KPI Achievement % (MTD), KPI Status (MTD) and KPI YoY % (MTD). Two line charts follow: CY MTD vs PY MTD vs Target MTD by Month, and CY YTD vs PY YTD vs Target YTD by Month.
Page 3: KPI Definition
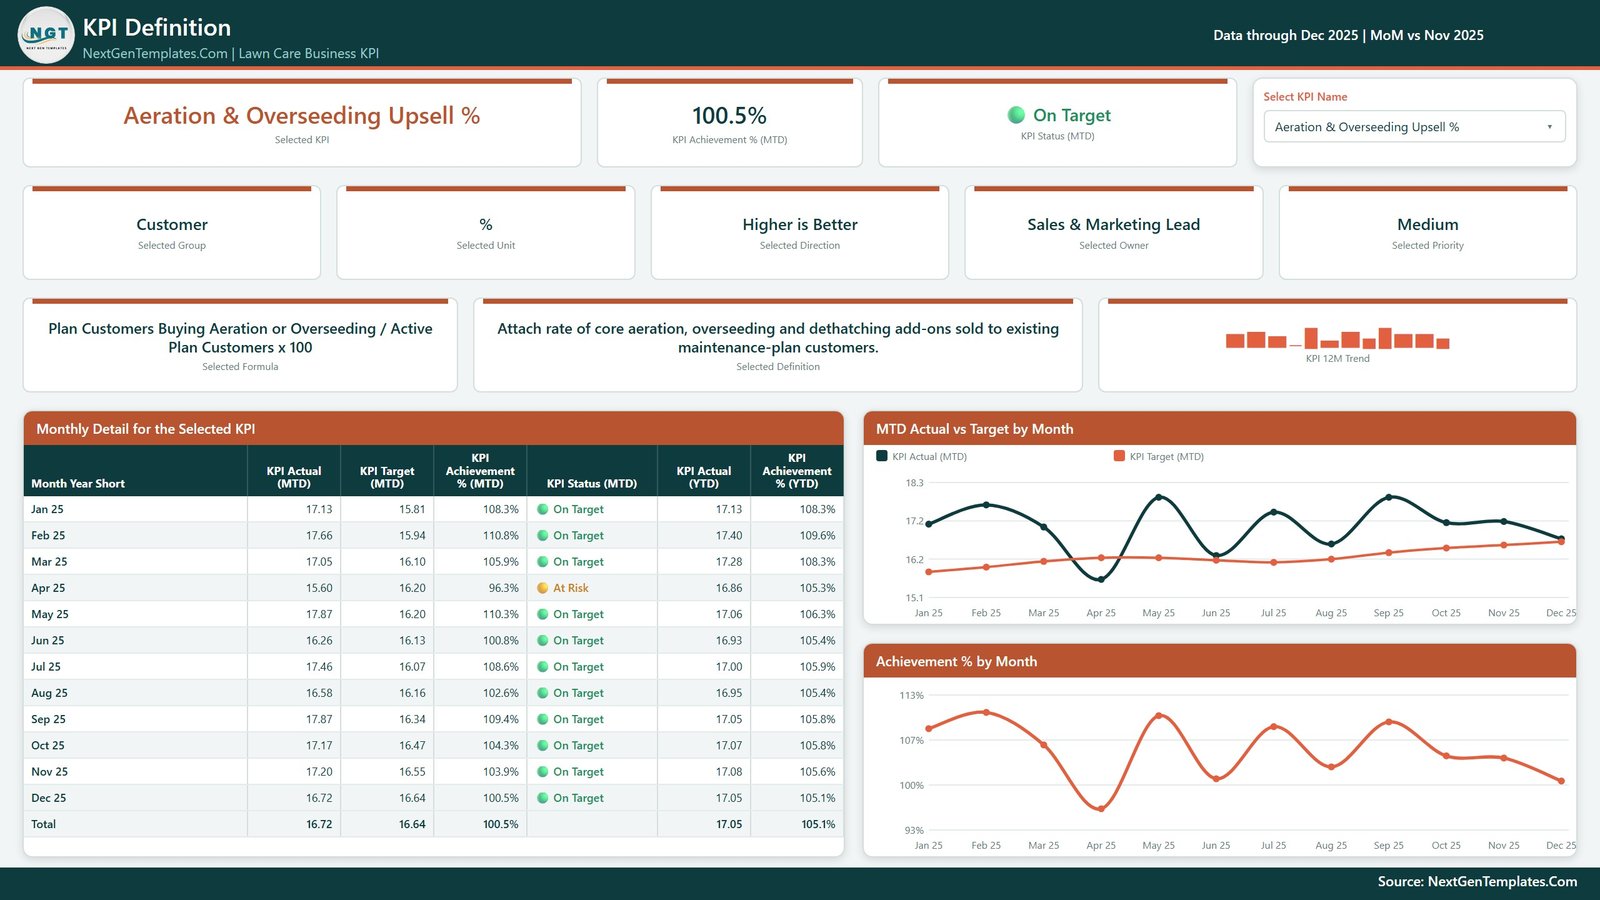
The documentation page, synced to the same KPI choice. It surfaces the Selected Formula and Selected Definition in plain English — Aeration & Overseeding Upsell % is defined as “Plan Customers Buying Aeration or Overseeding / Active Plan Customers x 100” — alongside a 12M trend, a Monthly Detail table carrying Actual, Target, Achievement % and Status for all twelve months on both MTD and YTD bases, and two charts: MTD Actual vs Target by Month and Achievement % by Month.
Page 4: Get More Templates
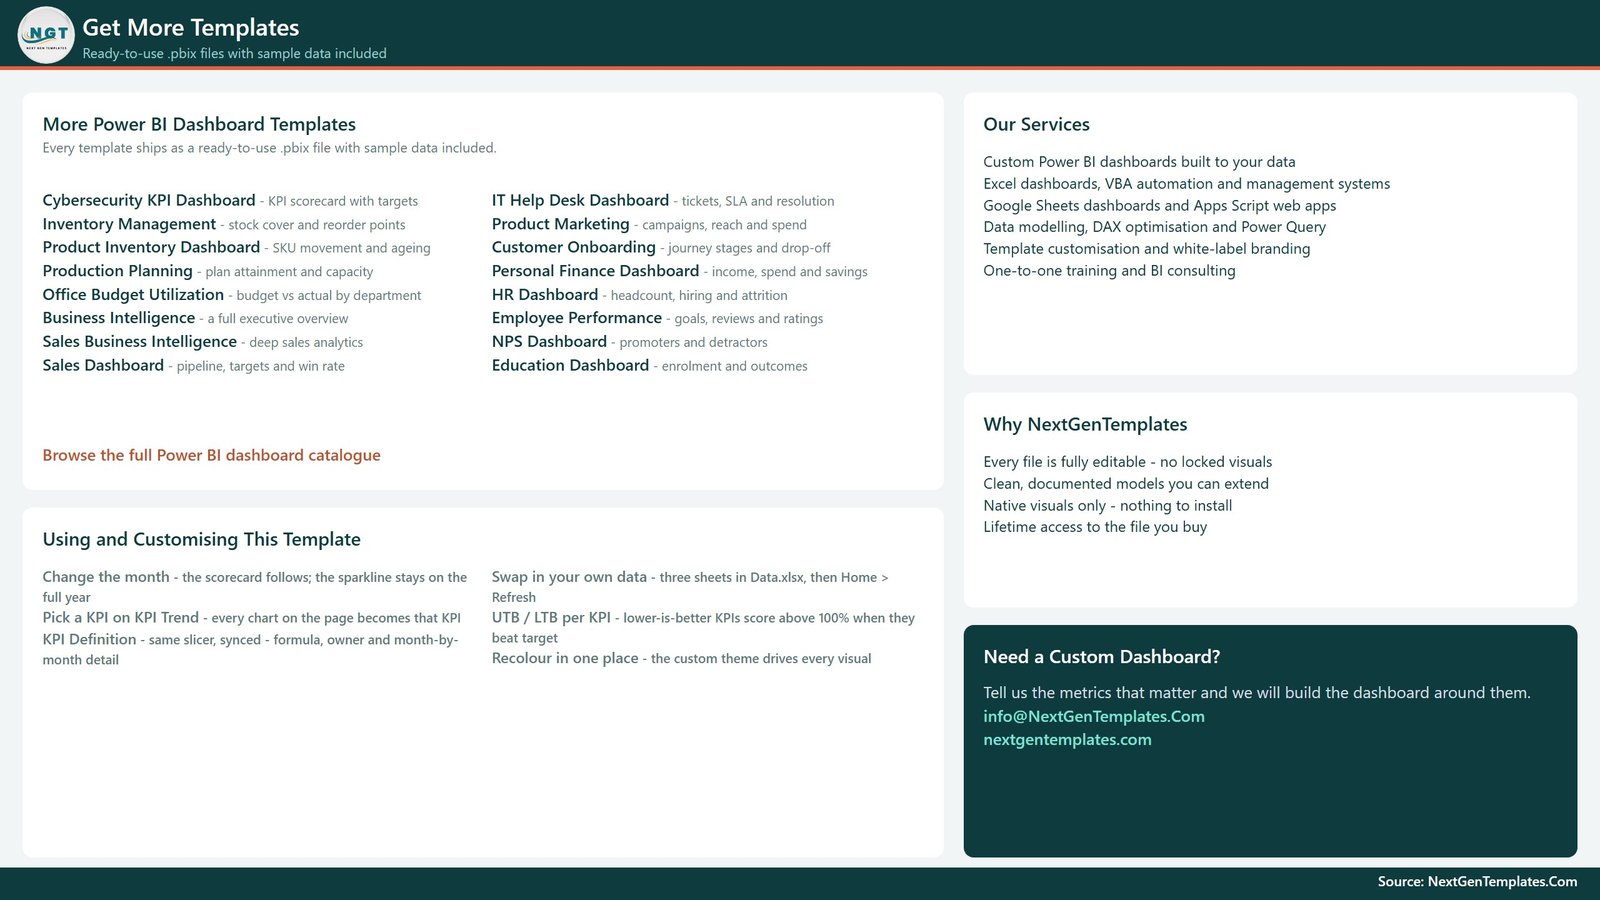
A reference page listing the wider Power BI catalogue and our services, plus a short “Using and Customising This Template” guide: how changing the month moves the scorecard while the sparkline stays on the full year, how to swap in your own data through the three sheets in Data.xlsx and refresh, how UTB/LTB scoring works per KPI, and where to recolour the theme.
Power BI Scorecard vs. Tableau / Qlik vs. Paid Field-Service SaaS — Feature Comparison
| Feature | This Power BI Scorecard | Tableau / Qlik build | Jobber / ServiceTitan reporting |
|---|---|---|---|
| Cost | $19.99 one-time | $70–$115 / user / month | $49–$400 / month per company |
| Platform | Power BI Desktop (free) | Tableau Desktop / Qlik Sense licence | Vendor web app only |
| Setup time | Under 15 minutes | Days of modelling | Full platform migration |
| KPIs pre-built | ✅ 13, with targets and definitions | ❌ Build every measure yourself | Fixed vendor metric set |
| Owner / priority per KPI | ✅ Built in | ❌ Custom work | Rarely exposed |
| Lower-is-better handling | ✅ Automatic UTB/LTB | ❌ Hand-coded | ❌ Not configurable |
| Editable model | ✅ Fully open .pbix | ✅ But licence-bound | ❌ Closed |
| Works with your existing data | ✅ Any source Power Query reads | ✅ | ❌ Only data already in the platform |
| Year-1 cost at 5 users | $19.99 | $4,200–$6,900 | $1,200–$4,800 |
For lawn care operators who want a board-ready monthly scorecard without a BI licence or a platform migration, this template sits in the sweet spot.
Who Should Use This Template
Perfect for:
- Owner-operators and general managers of lawn care and landscape maintenance firms running 2–40 crews
- Franchise and multi-branch groups that want one consistent scorecard format across every location
- Operations and finance leads who present a monthly KPI pack to owners, lenders or investors
- Power BI users who want a working example of direction-aware achievement, synced slicers and in-table sparklines
Not a fit if:
- You want scheduling, dispatch or route optimisation — the file integrates with no field-service platform such as Jobber, ServiceTitan or Yardbook, and performs no routing
- You need invoicing, payments or payroll — it does not invoice and stores no customer records
- You expect weather or radar data to move jobs automatically — there is no weather integration
- You need live data — this is a monthly scorecard refreshed from a workbook, not a real-time feed
- You need chemical-application logs for state compliance — Chemical Cost per 1K Sq Ft is a cost metric, not an application record
Real-World Use Cases
Marcus runs a 6-crew lawn care company in Georgia. Each month he pastes his figures into Data.xlsx, refreshes, and prints the scorecard for his Monday leadership call. Last quarter the YoY arrows showed Customer Acquisition Cost up 9.7% while New Customers Acquired sat under target — two facts his old spreadsheet never put next to each other, and which sent him back to review his lead sources.
Priya is operations director for a landscape group with four branches. She keeps one file per branch and uses the Owner slicer to narrow the scorecard to each branch manager ahead of their review, so the conversation stays on the KPIs that person actually controls.
Dan is a Power BI analyst at a franchise head office. He bought the file mainly for the model: the UTB/LTB achievement pattern and the synced KPI-selection design lifted straight into a larger report, saving him the direction-aware DAX from scratch.
Advantages of the Lawn Care Business KPI Dashboard in Power BI
It costs once. A five-person reporting seat on Tableau or Qlik runs into four figures in year one. This is a one-time purchase and Power BI Desktop is free, which keeps the whole reporting stack at the price of the file.
It is honest about the year. Because YTD achievement and a YTD traffic light sit beside the monthly ones, a good month cannot paper over a weak year. In the sample data Mower Downtime Hours reads At Risk for December but Missed for the year to date.
It is a model, not a picture. The .pbix is fully open. Add a KPI as a row in Data.xlsx and it appears on the scorecard, in the KPI Trend selector and on the KPI Definition page without touching a visual. Point Power Query at a database instead of the workbook and nothing downstream changes.
It documents itself. The KPI Definition page carries the formula and a plain-English definition for every metric, so a new branch manager can read what Route Density means without asking anyone.
Opportunities for Improvement
Honesty helps more than hype here. The template is a monthly scorecard: there is no daily or weekly grain, so if you need same-week crew reporting you will have to extend the date table yourself. It also assumes one operating entity per file — multi-branch groups keep one file per branch or add a branch column and a slicer.
The data source is a bundled workbook, so there is no out-of-the-box connector to field-service software. Exporting monthly figures and pasting them in takes a few minutes each period. And because it is a Power BI Desktop file, sharing it online with colleagues requires a Power BI Pro licence — emailing the .pbix or a PDF export is free, live web sharing is not.
Best Practices
A few habits separate a power bi kpi scorecard template that people actually read from one that quietly stops being opened after the second month.
- Keep the column headers in Data.xlsx exactly as they ship — the model binds to names, not positions
- Set each KPI’s direction deliberately. A cost KPI left on Higher is Better will score backwards and turn the traffic light the wrong colour
- Fill in the Owner field properly; the Owner slicer is what makes the scorecard usable in a review meeting
- Load at least 24 months so the YoY arrows and the prior-year lines on the KPI Trend page have something to compare against
- Write a real definition for every KPI — the KPI Definition page is only as useful as what you type into it
- Recolour in the theme file rather than per visual, or your next KPI will arrive in the wrong colours
Explore Relevant Templates
If you report on more than lawns, these cover the neighbouring ground. Landscaping Services KPI Dashboard in Power BI applies the same scorecard idea to a broader landscape operation, while Landscaping Dashboard in Power BI and Landscaping Services Dashboard in Power BI are analytical builds — they explore jobs, revenue and customers rather than scoring fixed targets. Many operators run one of each.
Also available as: the same monthly scorecard is published for Google Sheets as the Lawn Care Business KPI Dashboard in Google Sheets, with a sister build as the Lawn Care Business KPI Scorecard in Google Sheets. For arborist crews, see the Tree Care Services KPI Dashboard in Power BI.
Frequently Asked Questions
What KPIs does this lawn care KPI dashboard track?
It tracks 13 KPIs across five groups: Chemical Cost per 1K Sq Ft, Fuel Cost per Route and Crew Labor Cost % of Revenue under Cost Control; Customer Acquisition Cost, New Customers Acquired and Monthly Recurring Revenue under Revenue & Growth; Revenue per Man-Hour, Route Density and Avg Revenue per Lawn Visit under Crew Productivity; Mower Downtime Hours under Equipment; and Aeration & Overseeding Upsell %, Customer Retention Rate % and Re-Service Callback Rate % under Customer.
Do I need a paid Power BI licence?
No. Power BI Desktop is free from Microsoft and opens the .pbix, refreshes it and edits every visual. A Power BI Pro licence is only needed to publish the report to the Power BI Service and share it online with colleagues.
How long does setup take?
Under 15 minutes for most users. Open Data.xlsx, paste your months, actuals and targets over the sample rows in its three sheets, keep the headers unchanged, then click Home > Refresh in Power BI Desktop. All four pages of the Lawn Care Business KPI Dashboard in Power BI repopulate from your numbers.
Does it connect to Jobber, ServiceTitan or Yardbook?
No. There is no integration with any scheduling, dispatch or invoicing platform. The report reads the bundled Data.xlsx, so you export monthly figures from whatever system you run and paste them in. Since the source is plain Power Query, an analyst can repoint it at a database or API later.
How does this compare to paying for ServiceTitan reporting?
ServiceTitan and similar platforms report only on data already inside them, and bill monthly per company. This file costs once, reads whatever you can export, and lets you define your own KPIs, targets, owners and directions. It does not replace the operational platform — it reports across it.
Can I add my own KPIs?
Yes. KPIs are rows in Data.xlsx rather than hard-coded visuals. Add a row with a group, unit, owner, priority, direction, formula and definition, refresh, and the new KPI appears on the scorecard, in the KPI Trend selector and on the KPI Definition page automatically.
Is the sample data real?
No. The file ships with fictional sample data running through December 2025 so every card, chart and traffic light renders before you connect your own figures. None of it reflects a real lawn care company, and no figure in it should be used as an industry benchmark.
About the Author
Built by PK — Microsoft Certified Professional with 15+ years of Excel, Google Sheets and Power BI experience. Founder of NextGenTemplates, reaching 300K+ subscribers across YouTube channels. Every template is hand-built and tested before release.
Conclusion
A lawn care business does not fail because nobody counted the revenue. It fails because chemical cost per thousand square feet crept up for six months while everyone watched the top line. The Lawn Care Business KPI Dashboard in Power BI puts 13 of those numbers on one page, scores each against its own target in its own direction, and shows the year beside the month so drift has nowhere to hide.
👉 Click here to purchase the Lawn Care Business KPI Dashboard in Power BI
Instant download · One-time payment · No subscription
🎥 For step-by-step video walkthroughs, visit Youtube.com/@PKAnExcelExpert.
Last updated: September 2026