New: NextGenTemplates Academy - video courses on Excel formulas with AI and Pivot Tables & dashboards. Early-bird: 20% off with code EARLYBIRD20 - first 20 orders only.See the courses →
PKComments Off on Car Wash Business KPI Dashboard in Excel
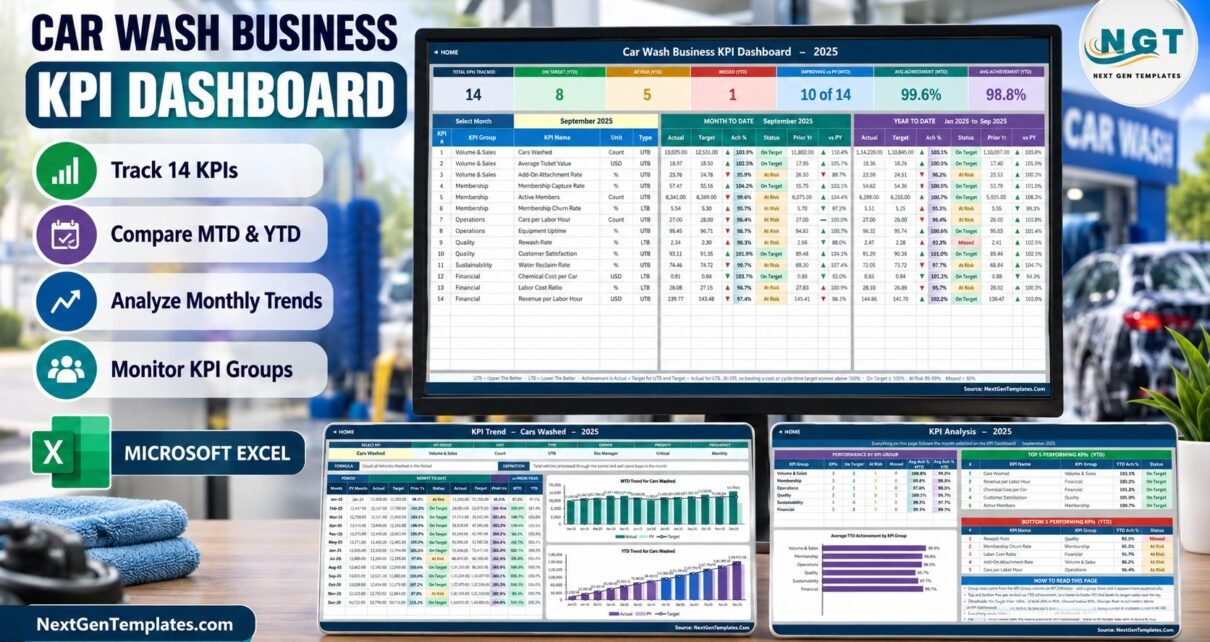
The Car Wash Business KPI Dashboard in Excel scores 14 car wash KPIs in 6 groups - month-to-date and year-to-date - against target and prior year, on a 10-sheet workbook
PKComments Off on Auto Body Shop KPI Dashboard in Excel
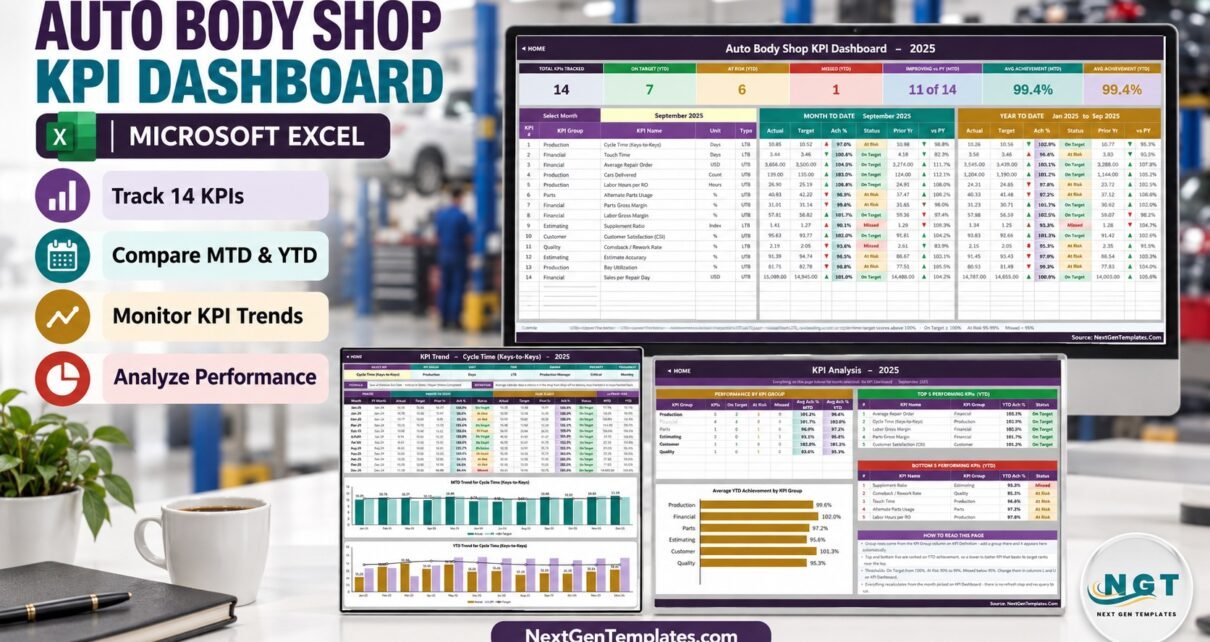
The Auto Body Shop KPI Dashboard in Excel turns a collision shop's monthly numbers into one scored view: 14 KPIs in 6 groups, each measured month to date and year
PKComments Off on Fencing Contractor KPI Dashboard in Excel
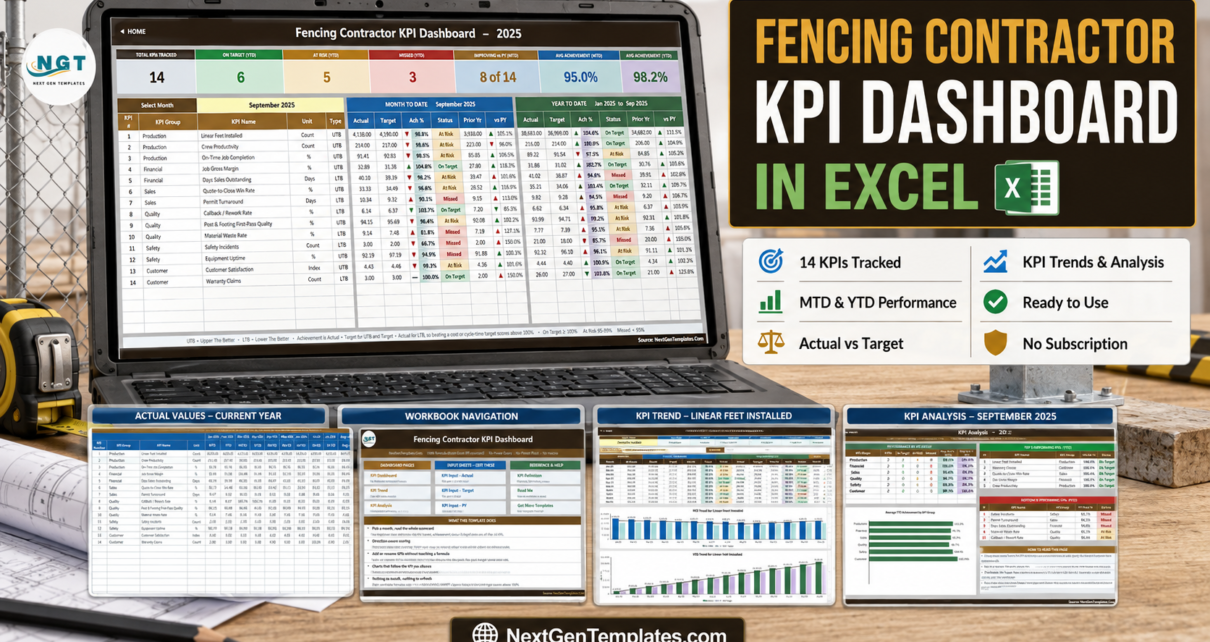
Most fencing contractors already know their numbers. The linear feet went in the ground, the permit either came back this week or it did not, the crew either got the
PKComments Off on Paving Contractor KPI Dashboard in Excel
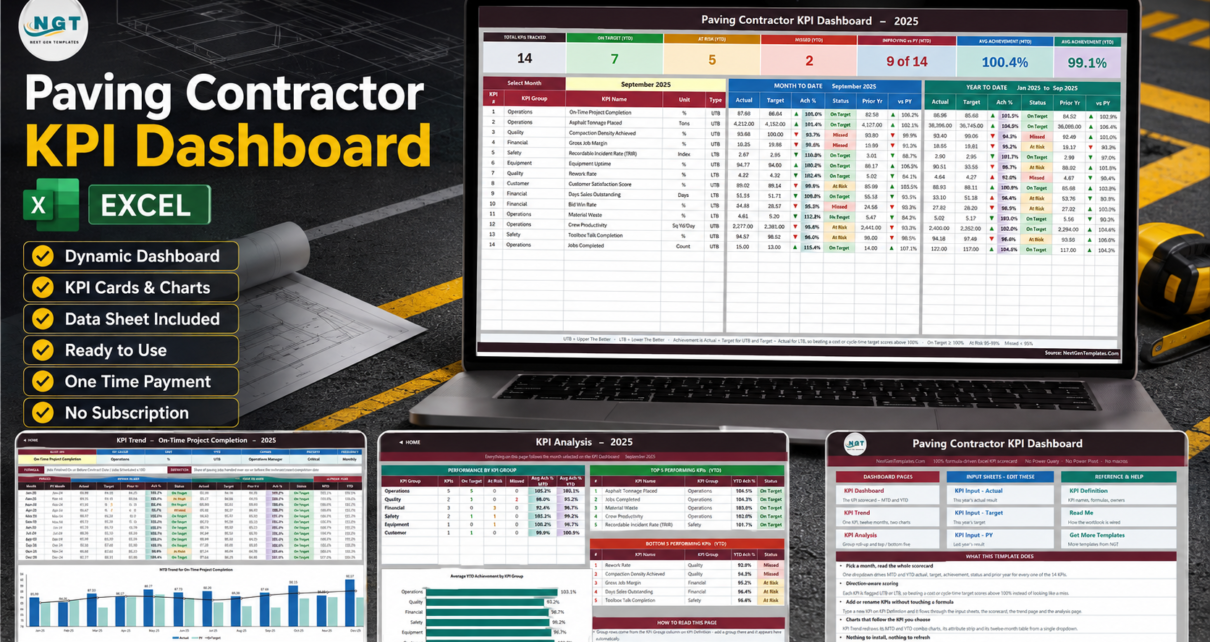
Paving is a business of thin margins and short seasons. You place the tonnage between the frost dates, you fight for density on every mat, and the money you make
PKComments Off on Concrete Contractor KPI Dashboard in Excel
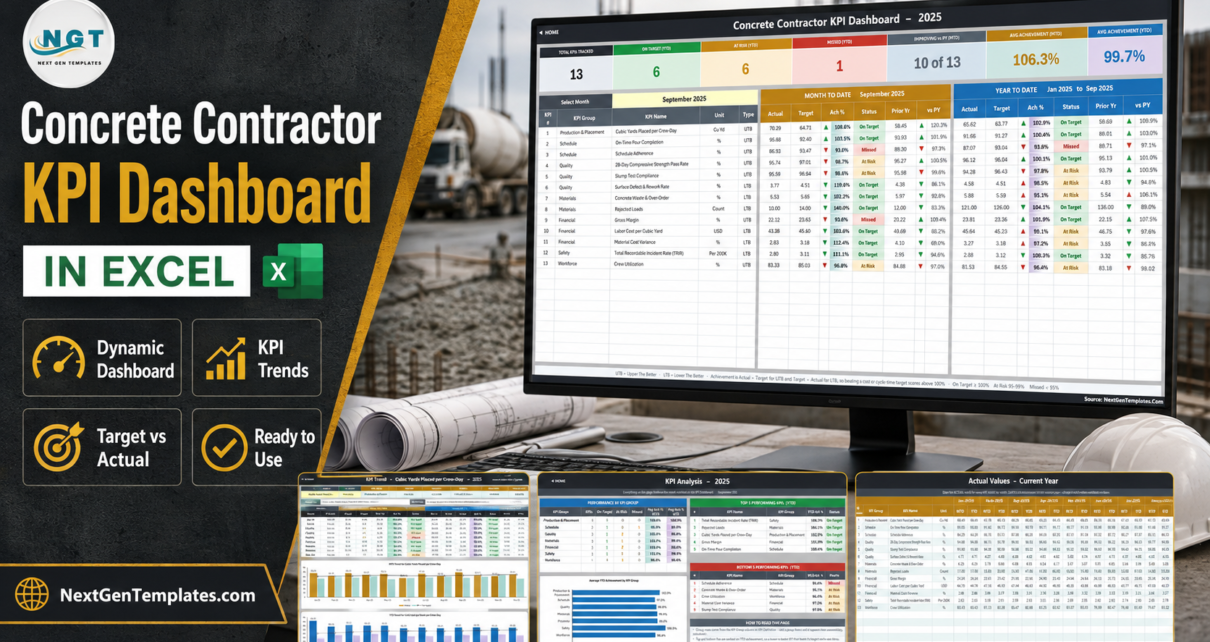
The Concrete Contractor KPI Dashboard in Excel tracks 13 concrete-specific KPIs across 7 KPI groups on 11 worksheets, with a single month dropdown that redraws seven summary cards and both
PKComments Off on Insulation Contractor KPI Dashboard in Excel
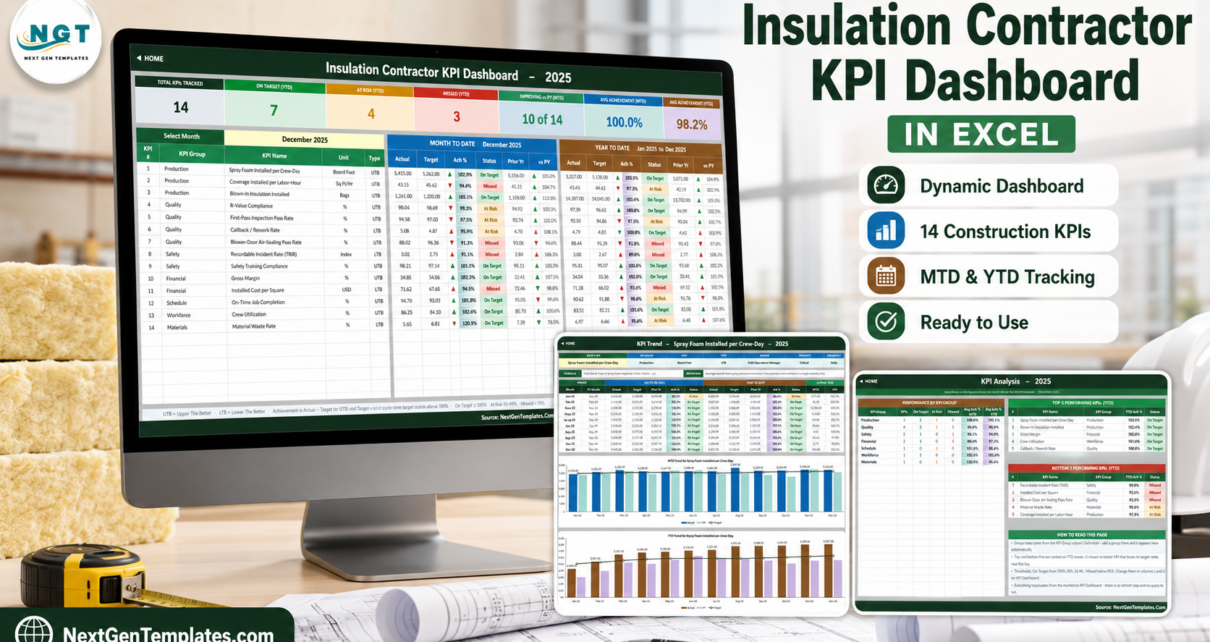
Most insulation contractors already know their numbers. Board feet went out the door, the blower-door test either passed or it did not, the callback happened or it did not. What
PKComments Off on Welding Shop KPI Dashboard in Excel
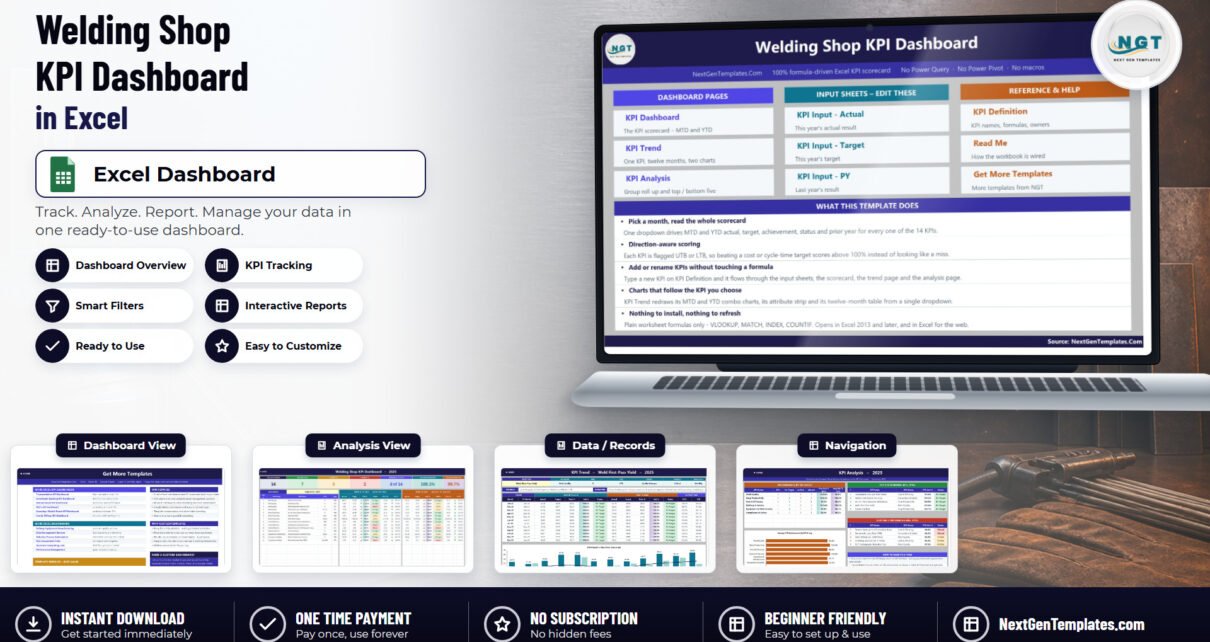
Most fabrication shops already know their numbers. The repair rate is in the QA log, arc-on time is in the machine report, rework hours are buried in a timesheet code,
PKComments Off on Energy Consumption Analysis Dashboard in Excel
Energy Consumption Analysis Dashboard in Excel is a powerful, ready-to-use interactive analytics template designed for energy managers, facility operators, sustainability officers, and operations teams who need a centralized solution to
PKComments Off on Startup Burn Rate Dashboard in Excel
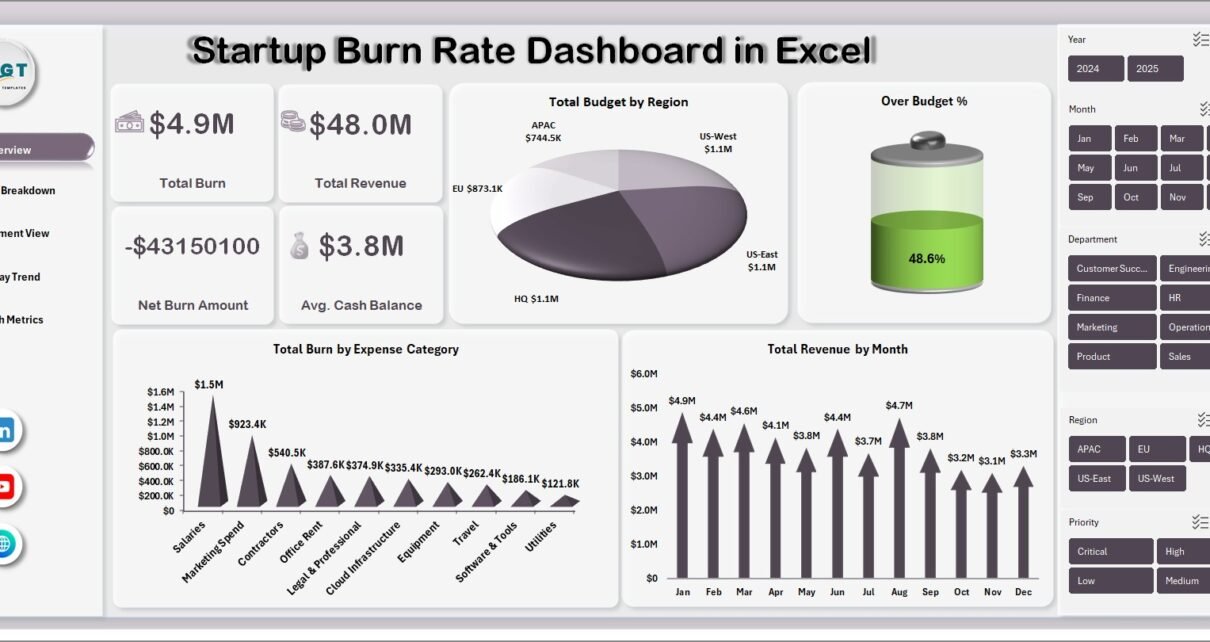
Startup Burn Rate Dashboard in Excel is a professionally designed, pivot-powered analytics template that gives startup founders, CFOs, and finance teams complete visibility into cash burn, revenue performance, expense breakdown,