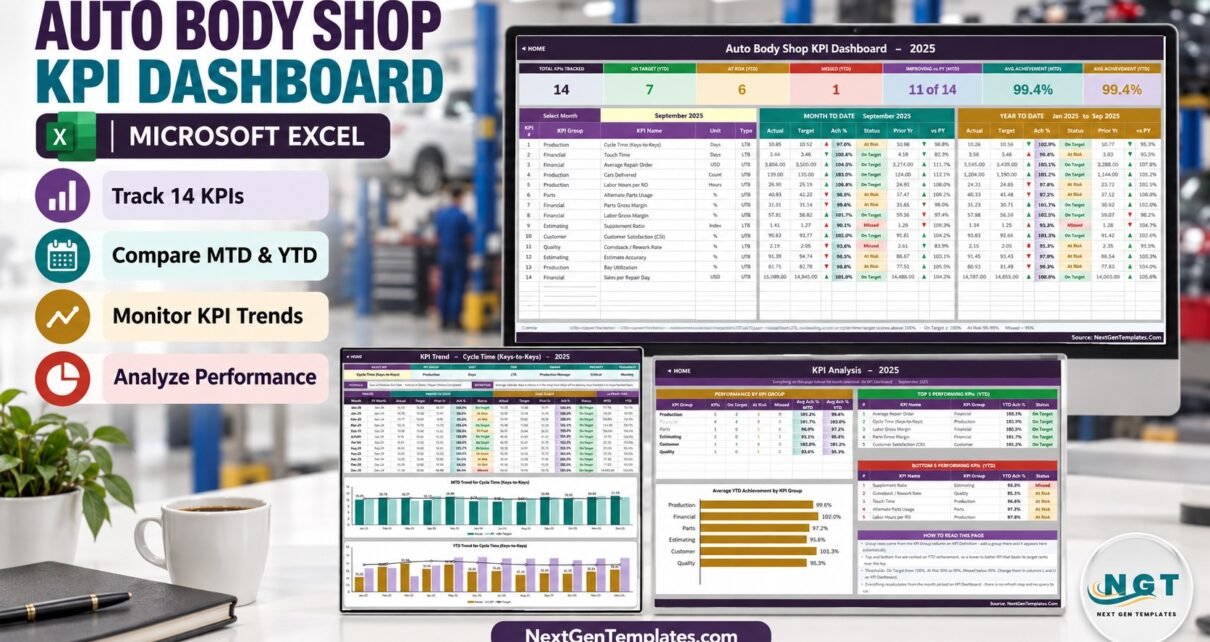
The Auto Body Shop KPI Dashboard in Excel turns a collision shop’s monthly numbers into one scored view: 14 KPIs in 6 groups, each measured month to date and year to date against target and prior year. It is an 11-sheet workbook that runs on plain worksheet formulas, with no macros, no Power Query and no add-ins, and it ships with a user manual PDF.
Most body shops already know their cycle time and their monthly sales. What is harder is seeing, on one page, whether cycle time, supplements, comebacks, parts and labor margins and customer satisfaction are all moving the right way at the same time. This template gives an owner or production manager that monthly picture from a single dropdown, and it scores lower-is-better metrics such as Cycle Time (Keys-to-Keys) correctly instead of treating a shorter cycle as a miss.
Key Features of the Auto Body Shop KPI Dashboard in Excel
- 14 ready-made KPIs: Cycle Time (Keys-to-Keys), Touch Time, Average Repair Order, Cars Delivered, Labor Hours per RO, Alternate Parts Usage, Parts Gross Margin, Labor Gross Margin, Supplement Ratio, Customer Satisfaction (CSI), Comeback / Rework Rate, Estimate Accuracy, Bay Utilization and Sales per Repair Day.
- Six KPI groups: Production (5 KPIs), Financial (4), Estimating (2), Parts (1), Customer (1) and Quality (1).
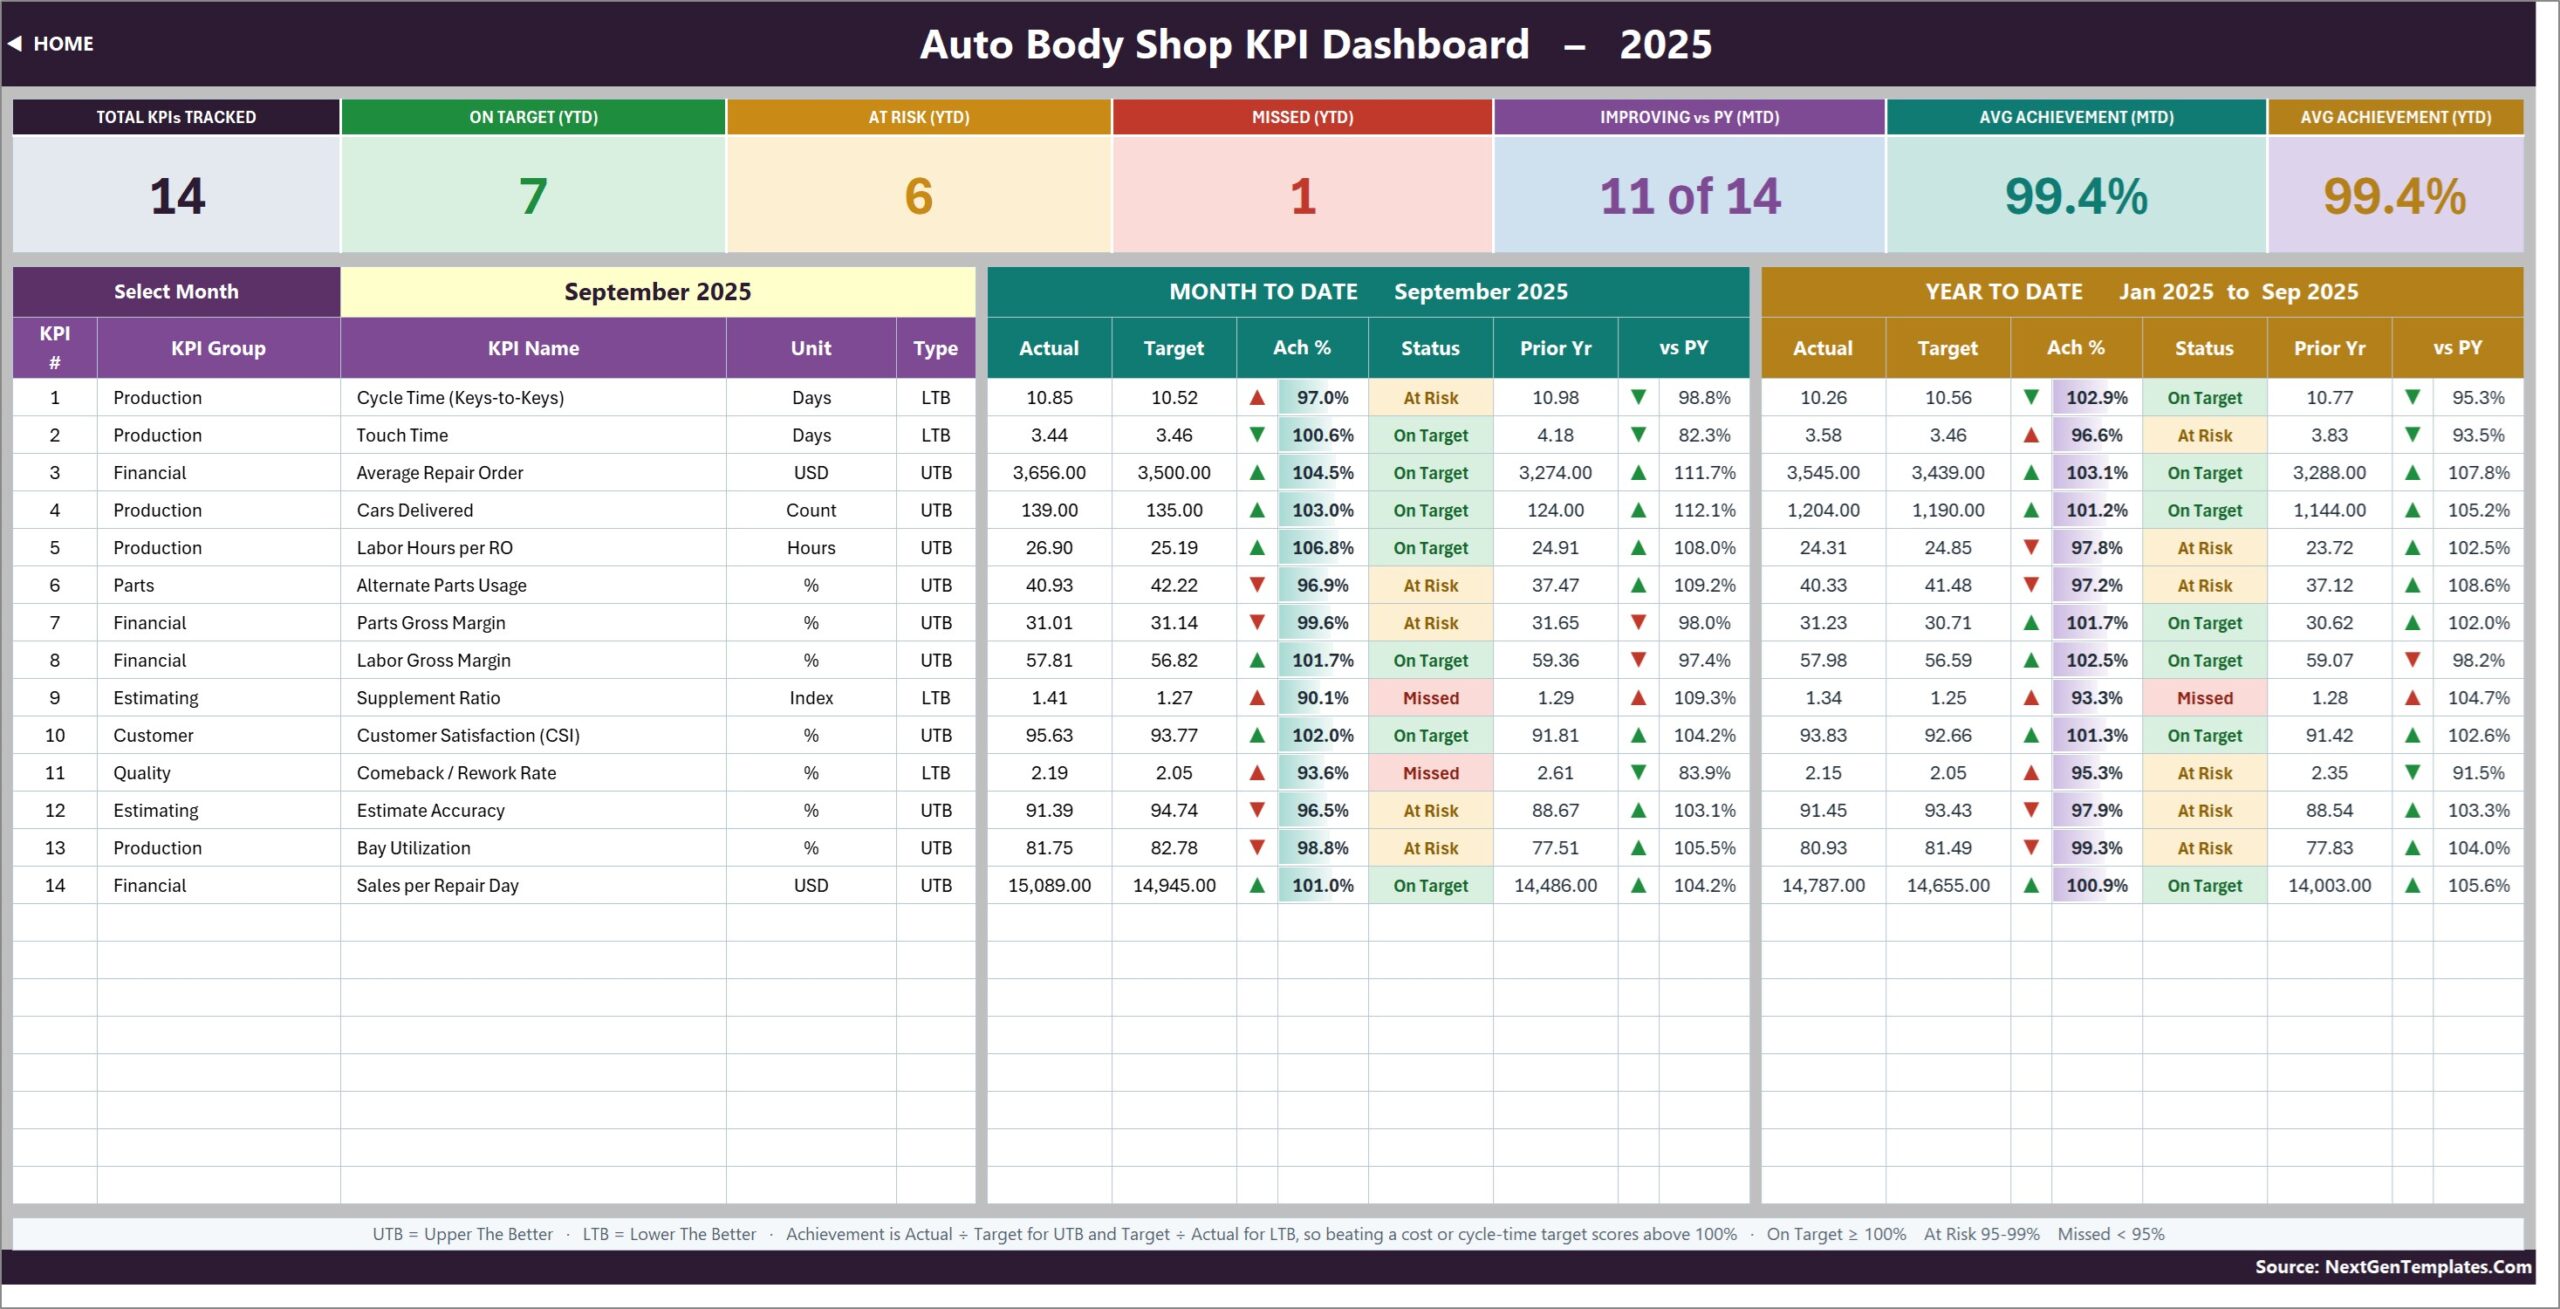
- Month picker: cell D6 on the KPI Dashboard sheet is a dropdown of the twelve months; the dashboard and the analysis page follow it.
- UTB and LTB scoring: 4 KPIs are Lower The Better and 10 are Upper The Better. Achievement is Actual ÷ Target for UTB and Target ÷ Actual for LTB.
- Status bands: On Target from 100%, At Risk from 95% to 99%, Missed below 95%.
- 22-KPI capacity: 14 rows are filled and 8 more are wired and empty.
Dashboard Pages Explanation
Home
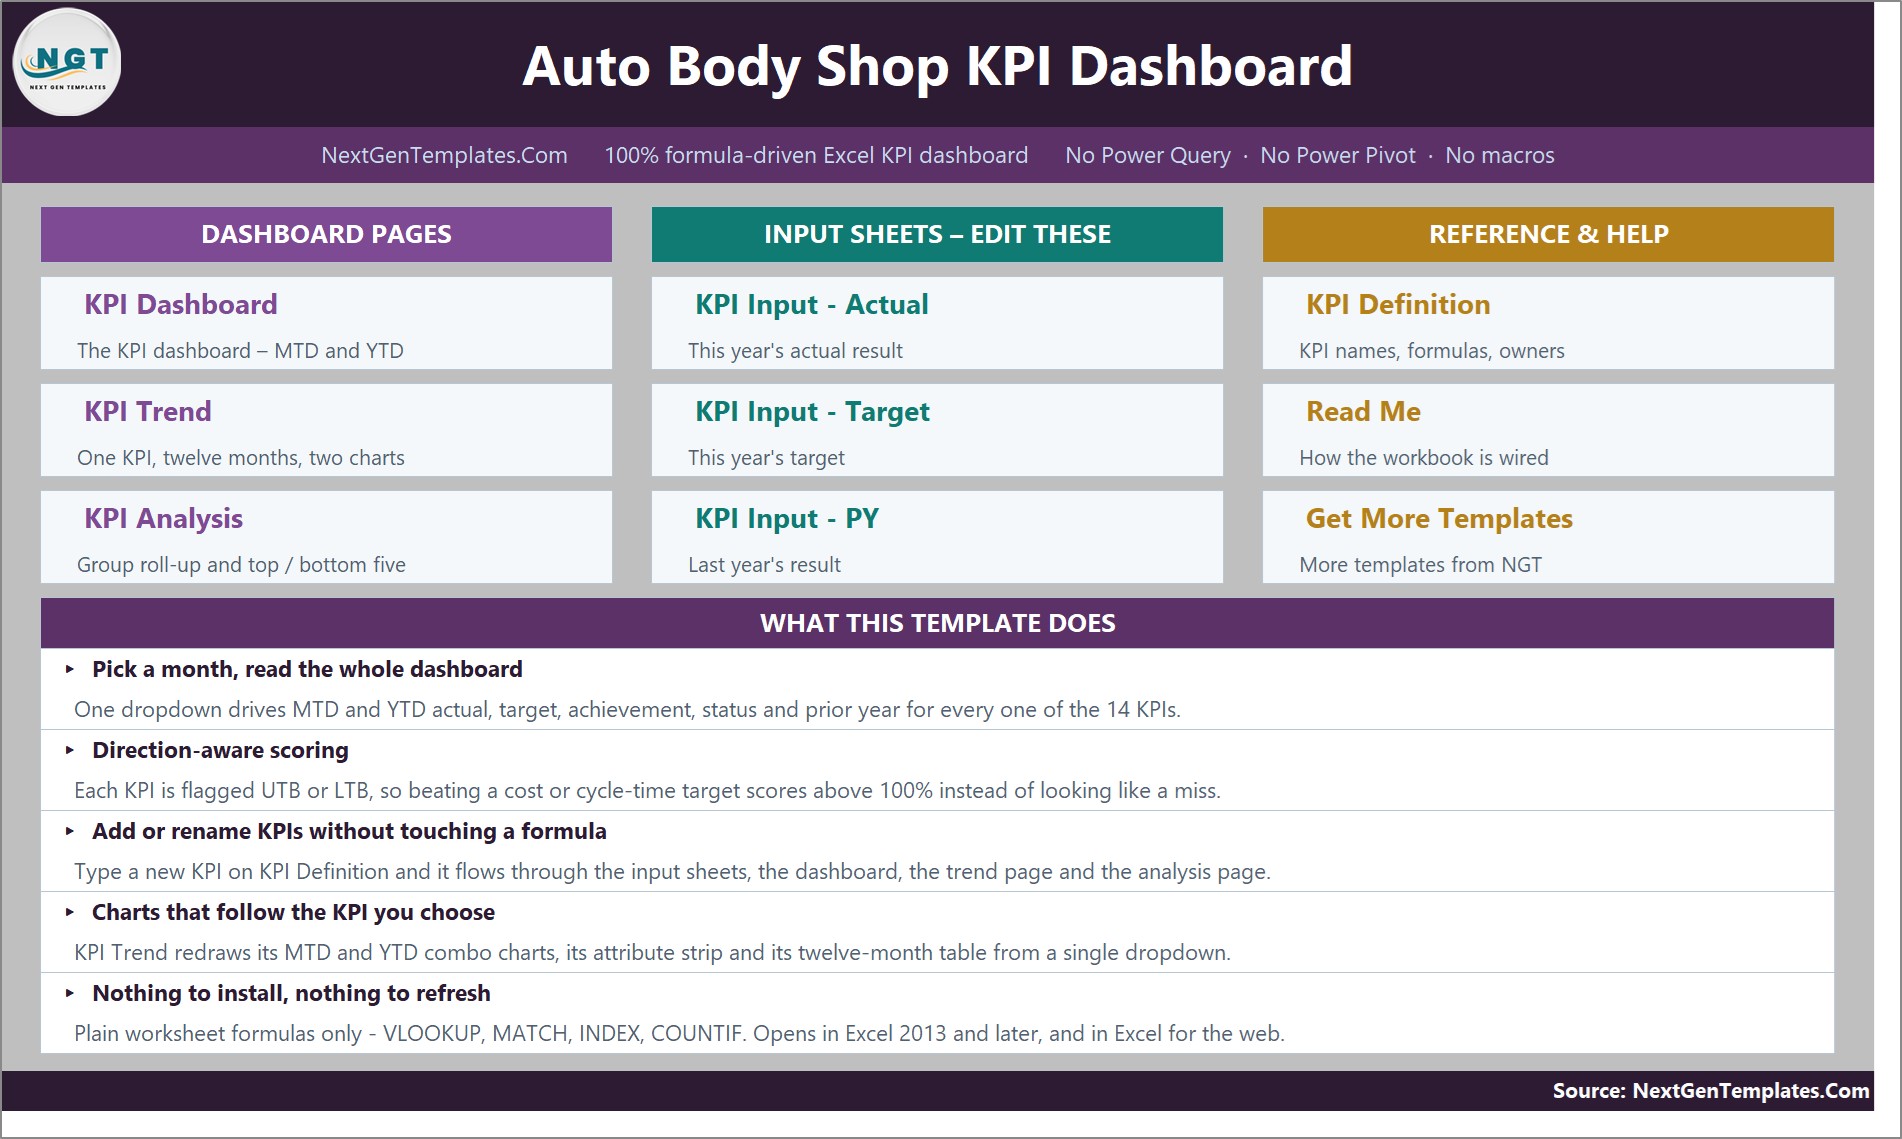
The Home sheet groups the workbook into Dashboard Pages, Input Sheets and Reference & Help, with a link to each, plus a five-point summary of what the template does.
KPI Dashboard
Seven cards sit across the top: Total KPIs Tracked, On Target (YTD), At Risk (YTD), Missed (YTD), Improving vs PY (MTD), Avg Achievement (MTD) and Avg Achievement (YTD). Below them, every KPI row shows KPI group, unit and type, then MTD and YTD actual, target, achievement %, status, prior year and vs PY with coloured arrows. In the sample year, September 2025 shows 7 KPIs On Target, 6 At Risk and 1 Missed year to date, 11 of 14 improving on prior year, and 99.4% average achievement.
KPI Trend
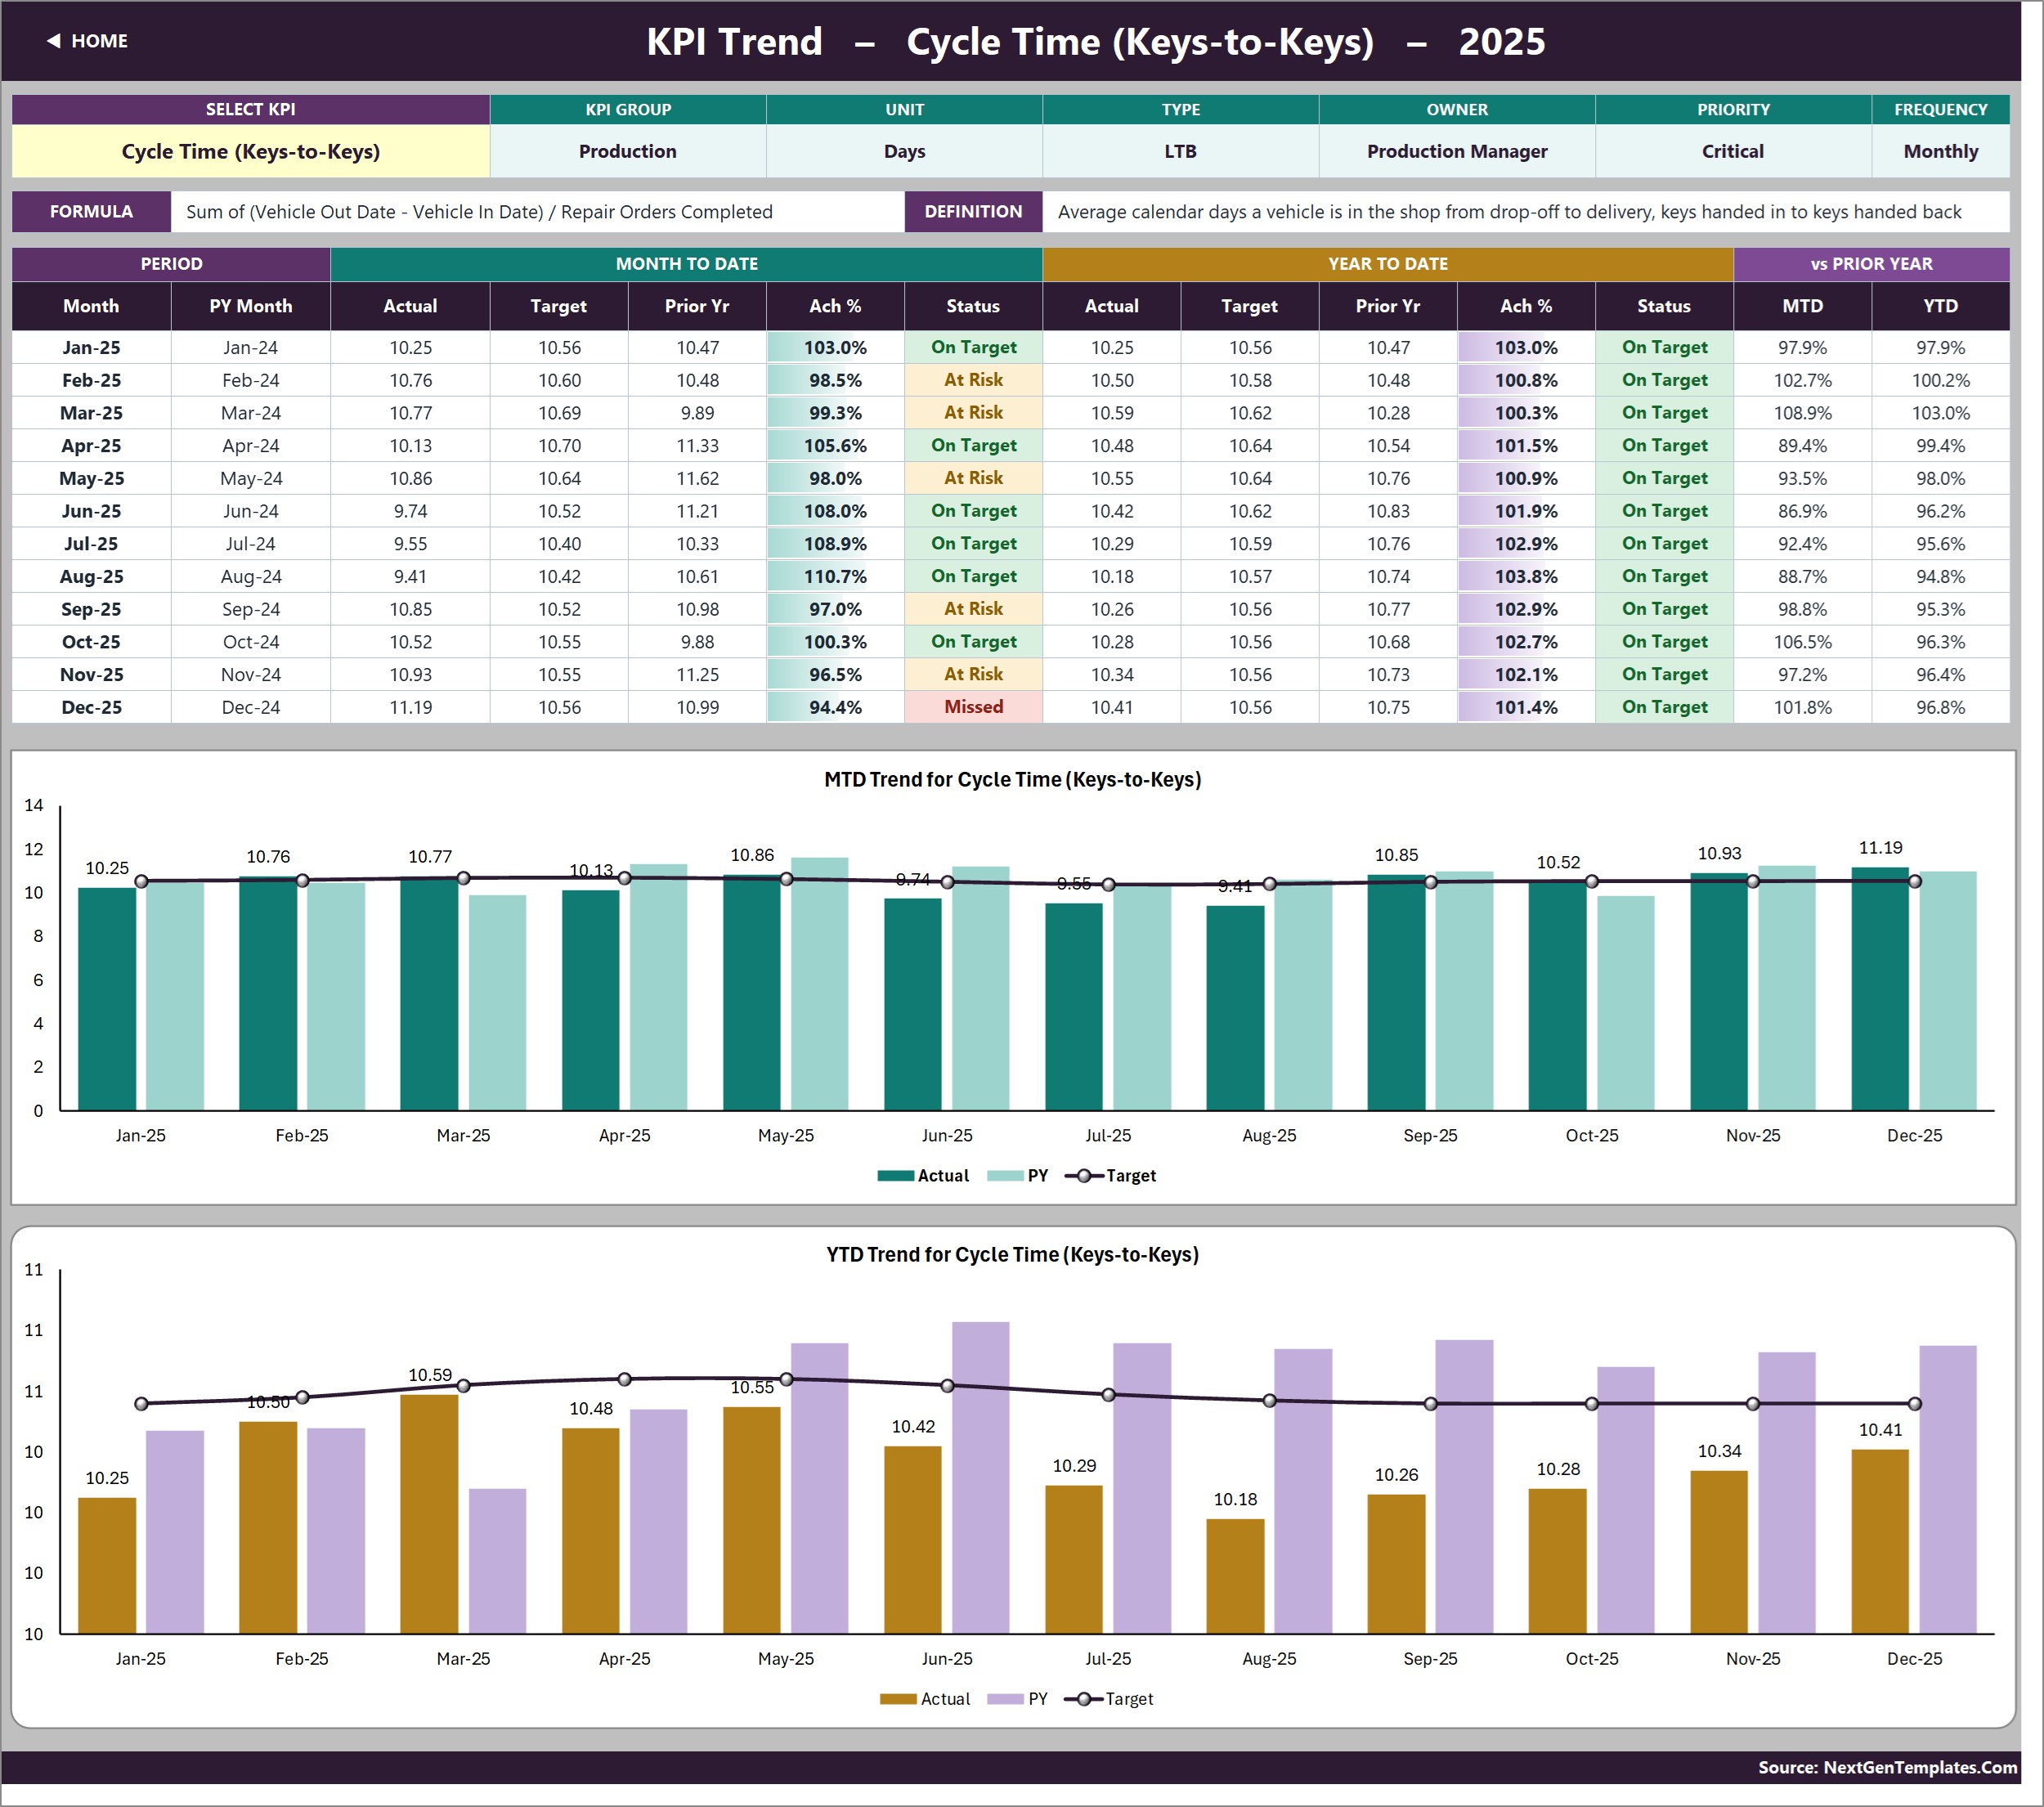
Choose one KPI in cell B4 and the page shows its group, unit, type, owner, priority, frequency, formula and definition. A twelve-month table lists MTD and YTD actual, target, prior year, achievement and status, and two combo charts, MTD Trend and YTD Trend, plot Actual and PY columns against a Target line.
KPI Analysis
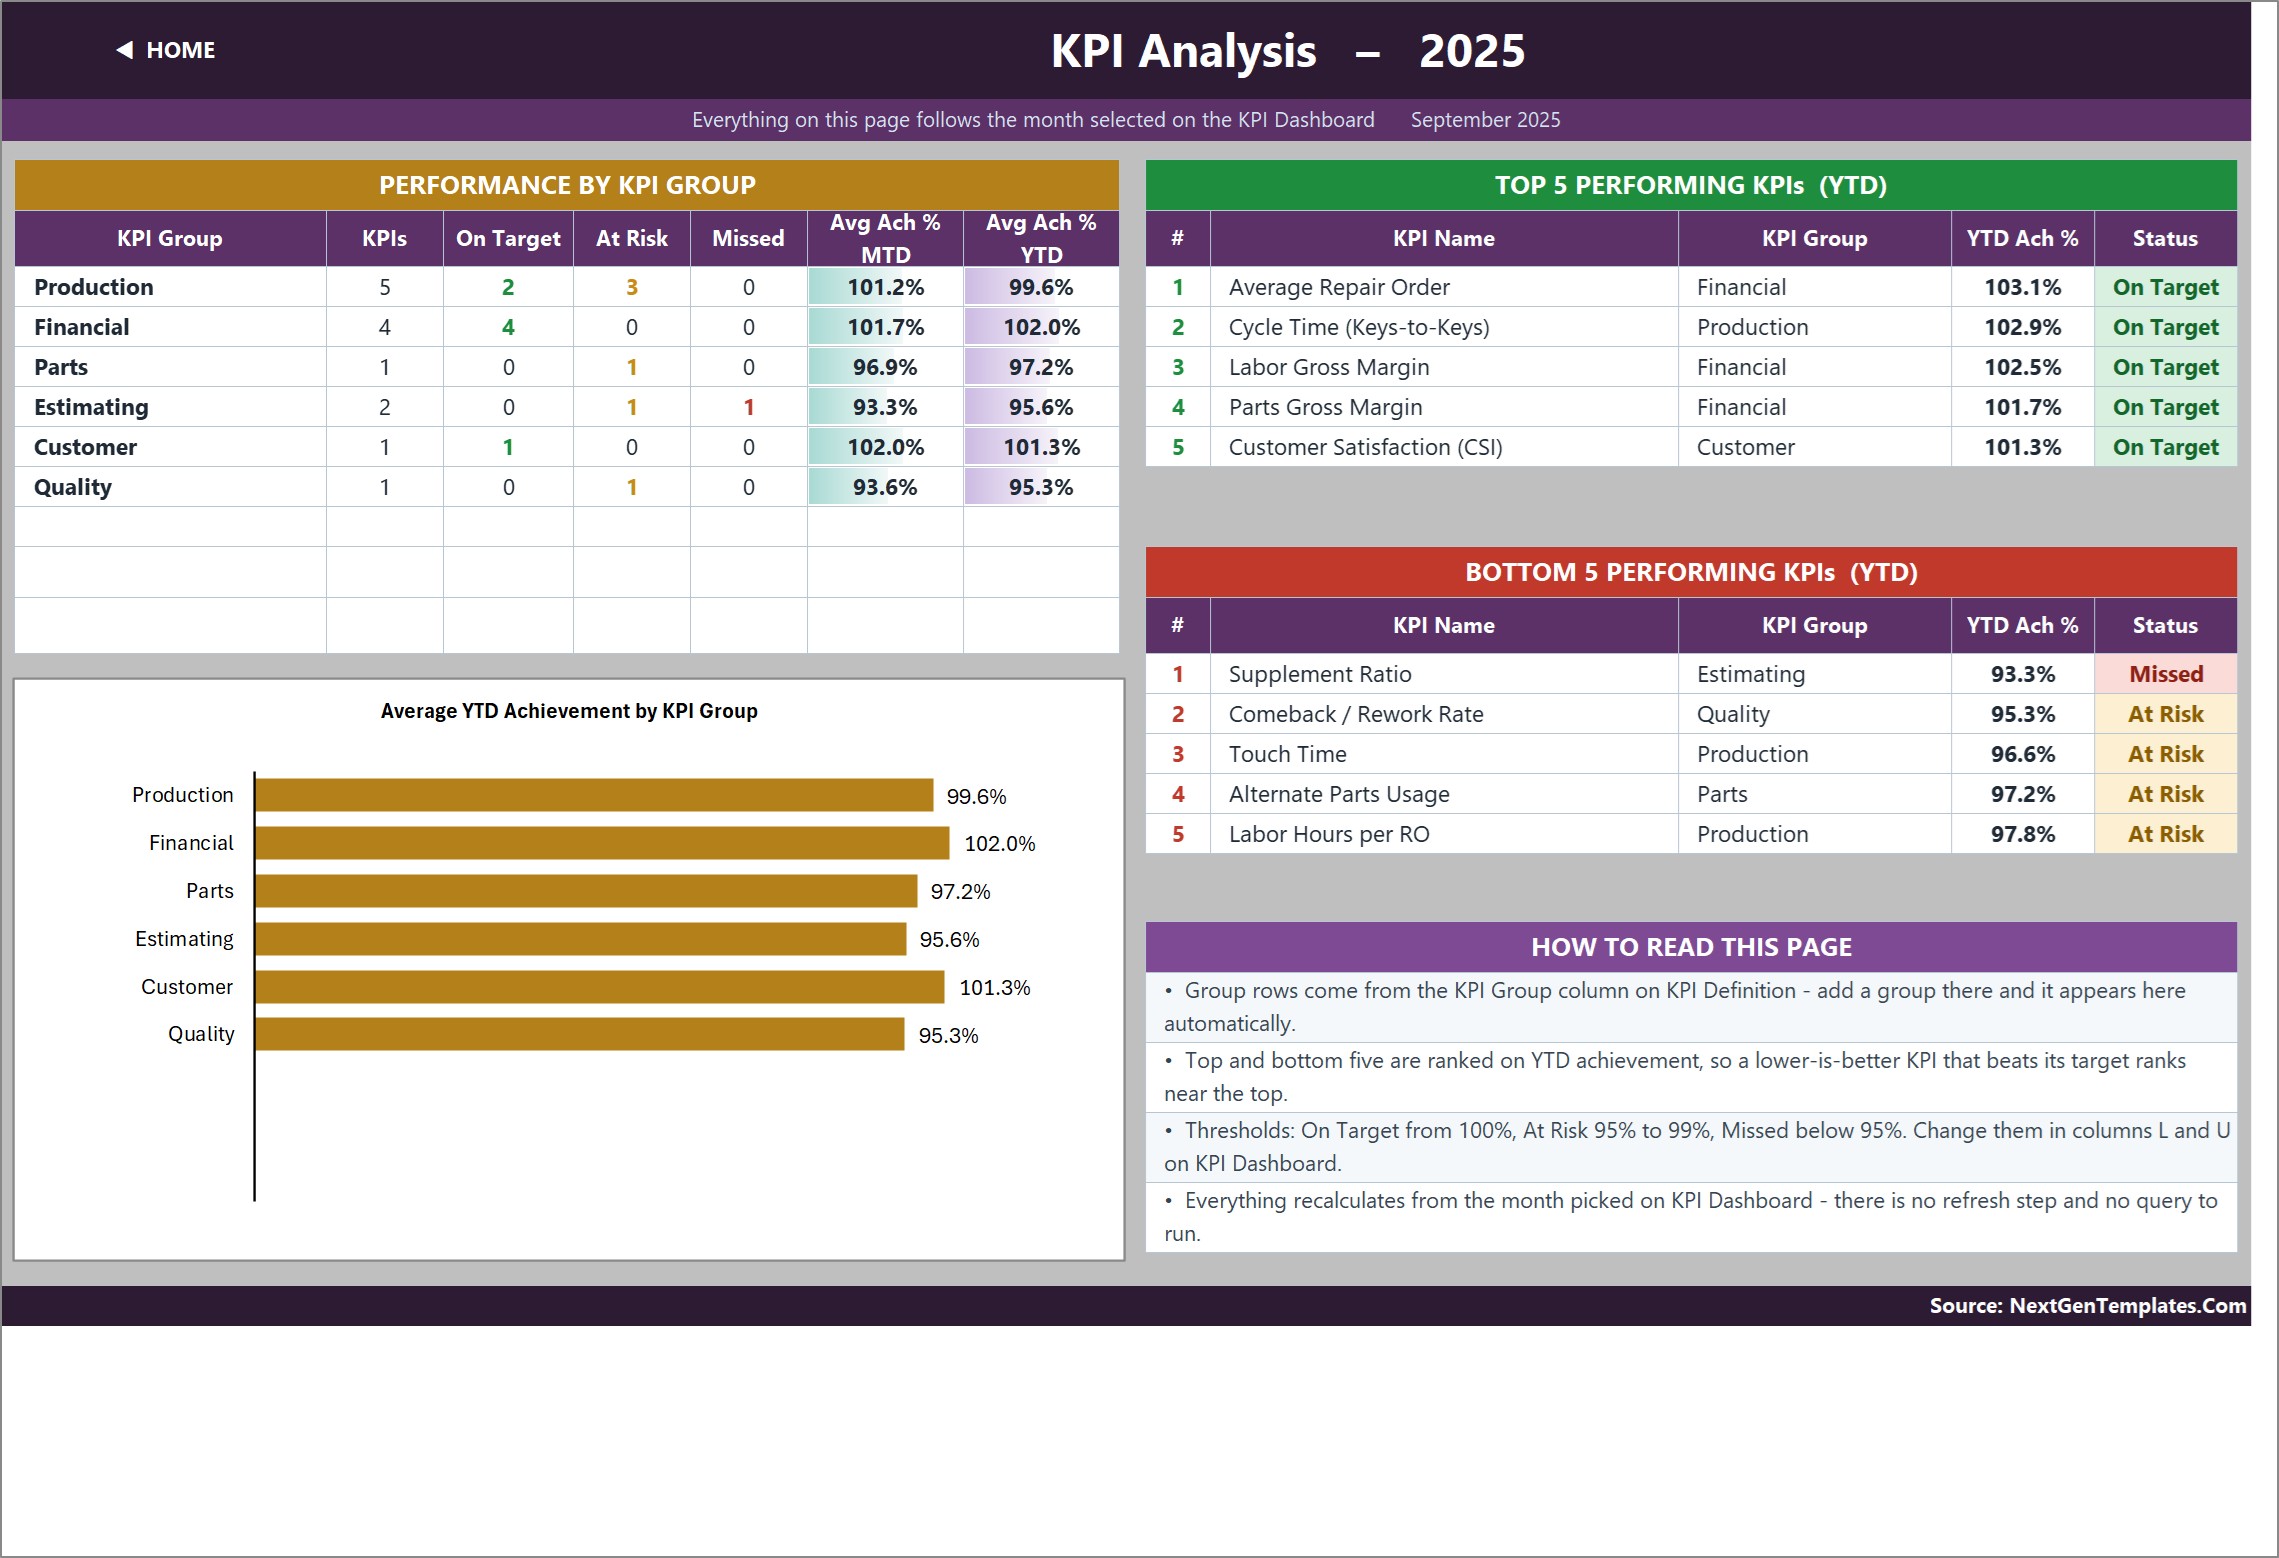
Performance by KPI Group counts KPIs, On Target, At Risk and Missed per group with average MTD and YTD achievement. The chart Average YTD Achievement by KPI Group sits below, and the right side ranks the Top 5 and Bottom 5 KPIs on YTD achievement. In the sample, Supplement Ratio and Comeback / Rework Rate lead the Bottom 5.
KPI Input – Actual, Target and PY
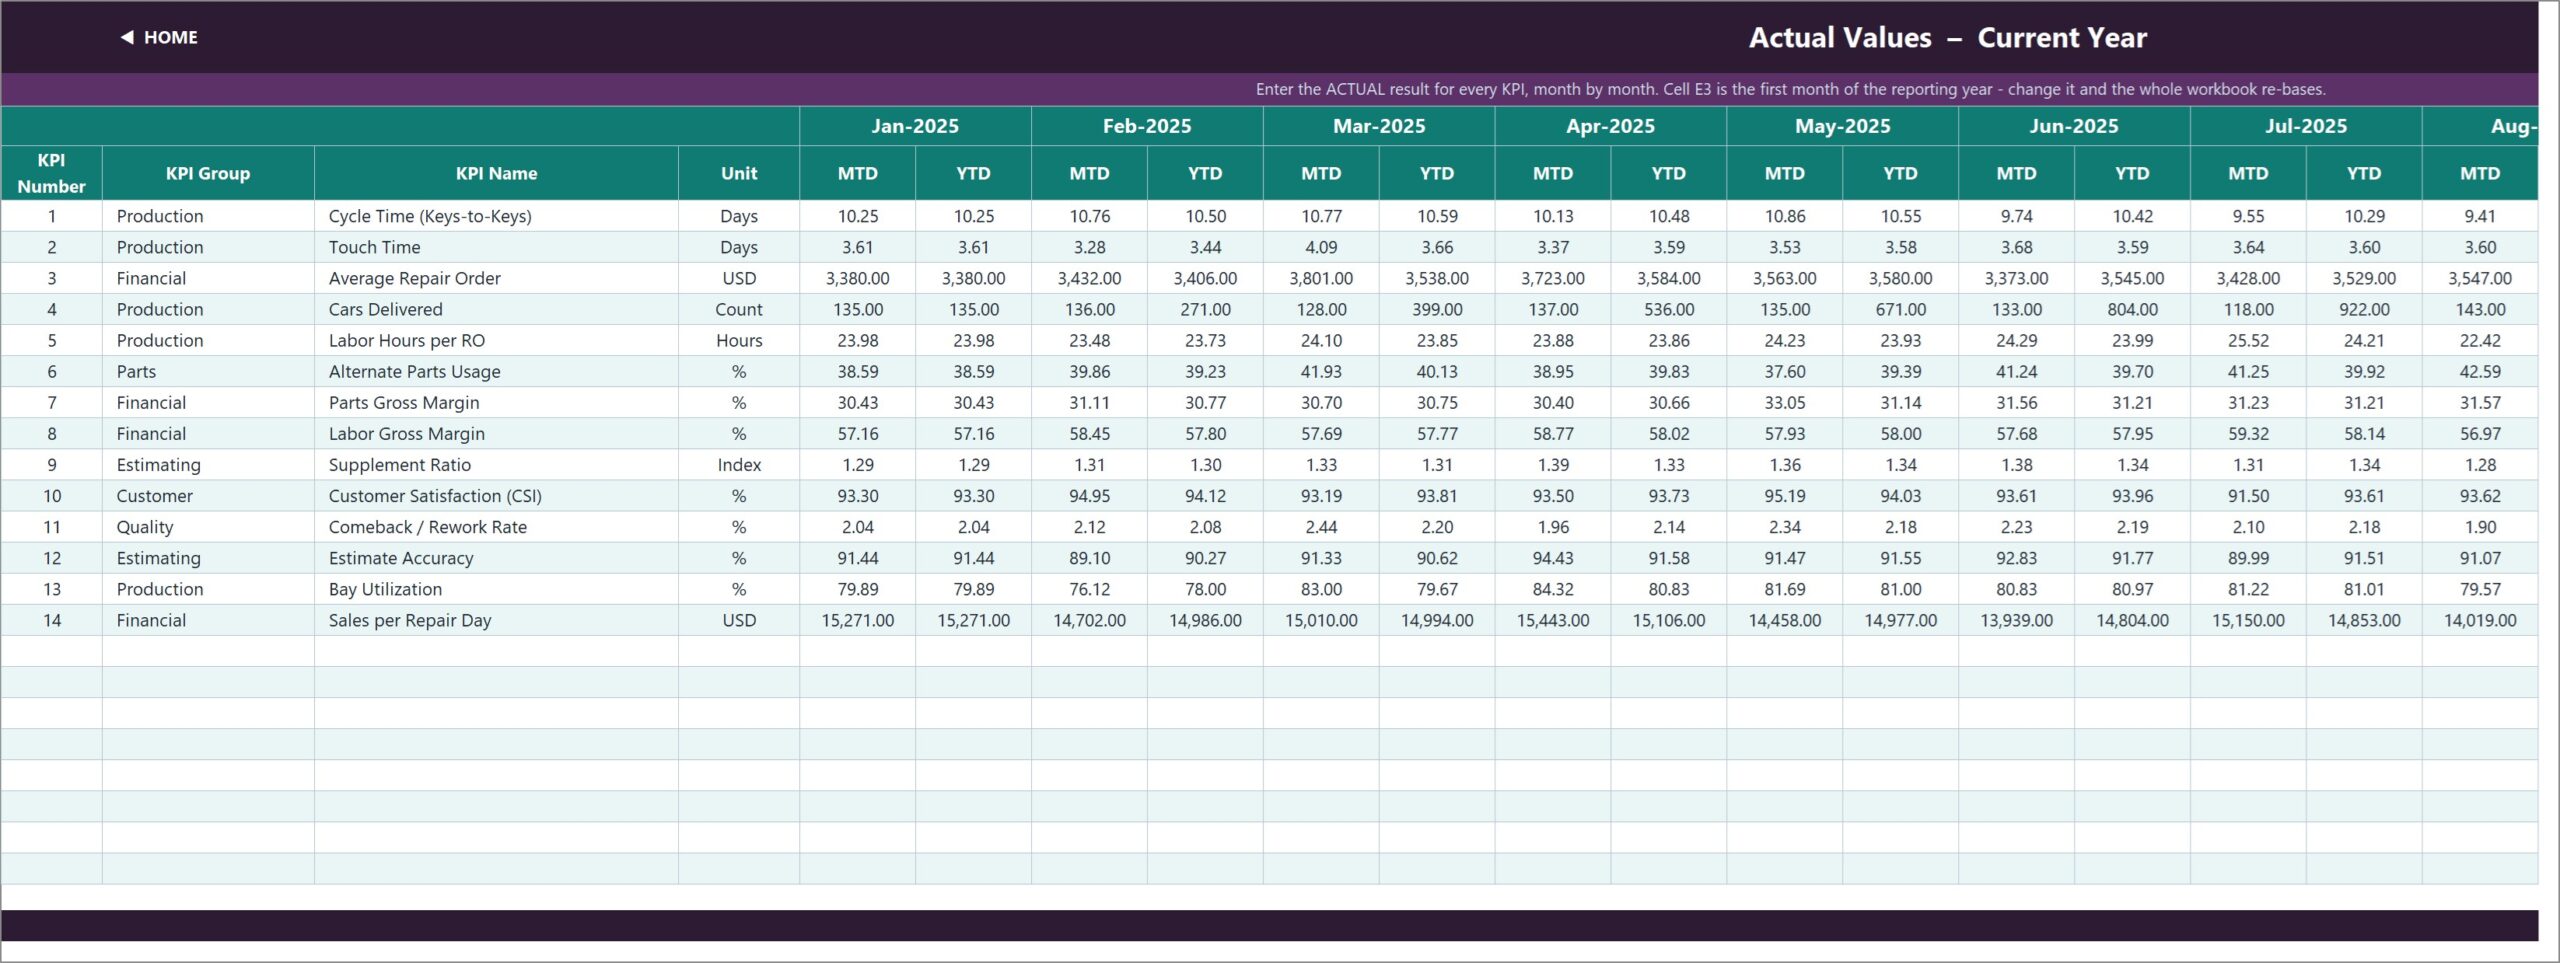
The three input sheets hold an MTD and a YTD column for each month. Cell E3 on KPI Input – Actual is the first month of the reporting year; the Target sheet, the Prior Year sheet and the month dropdown re-base from it.
KPI Definition
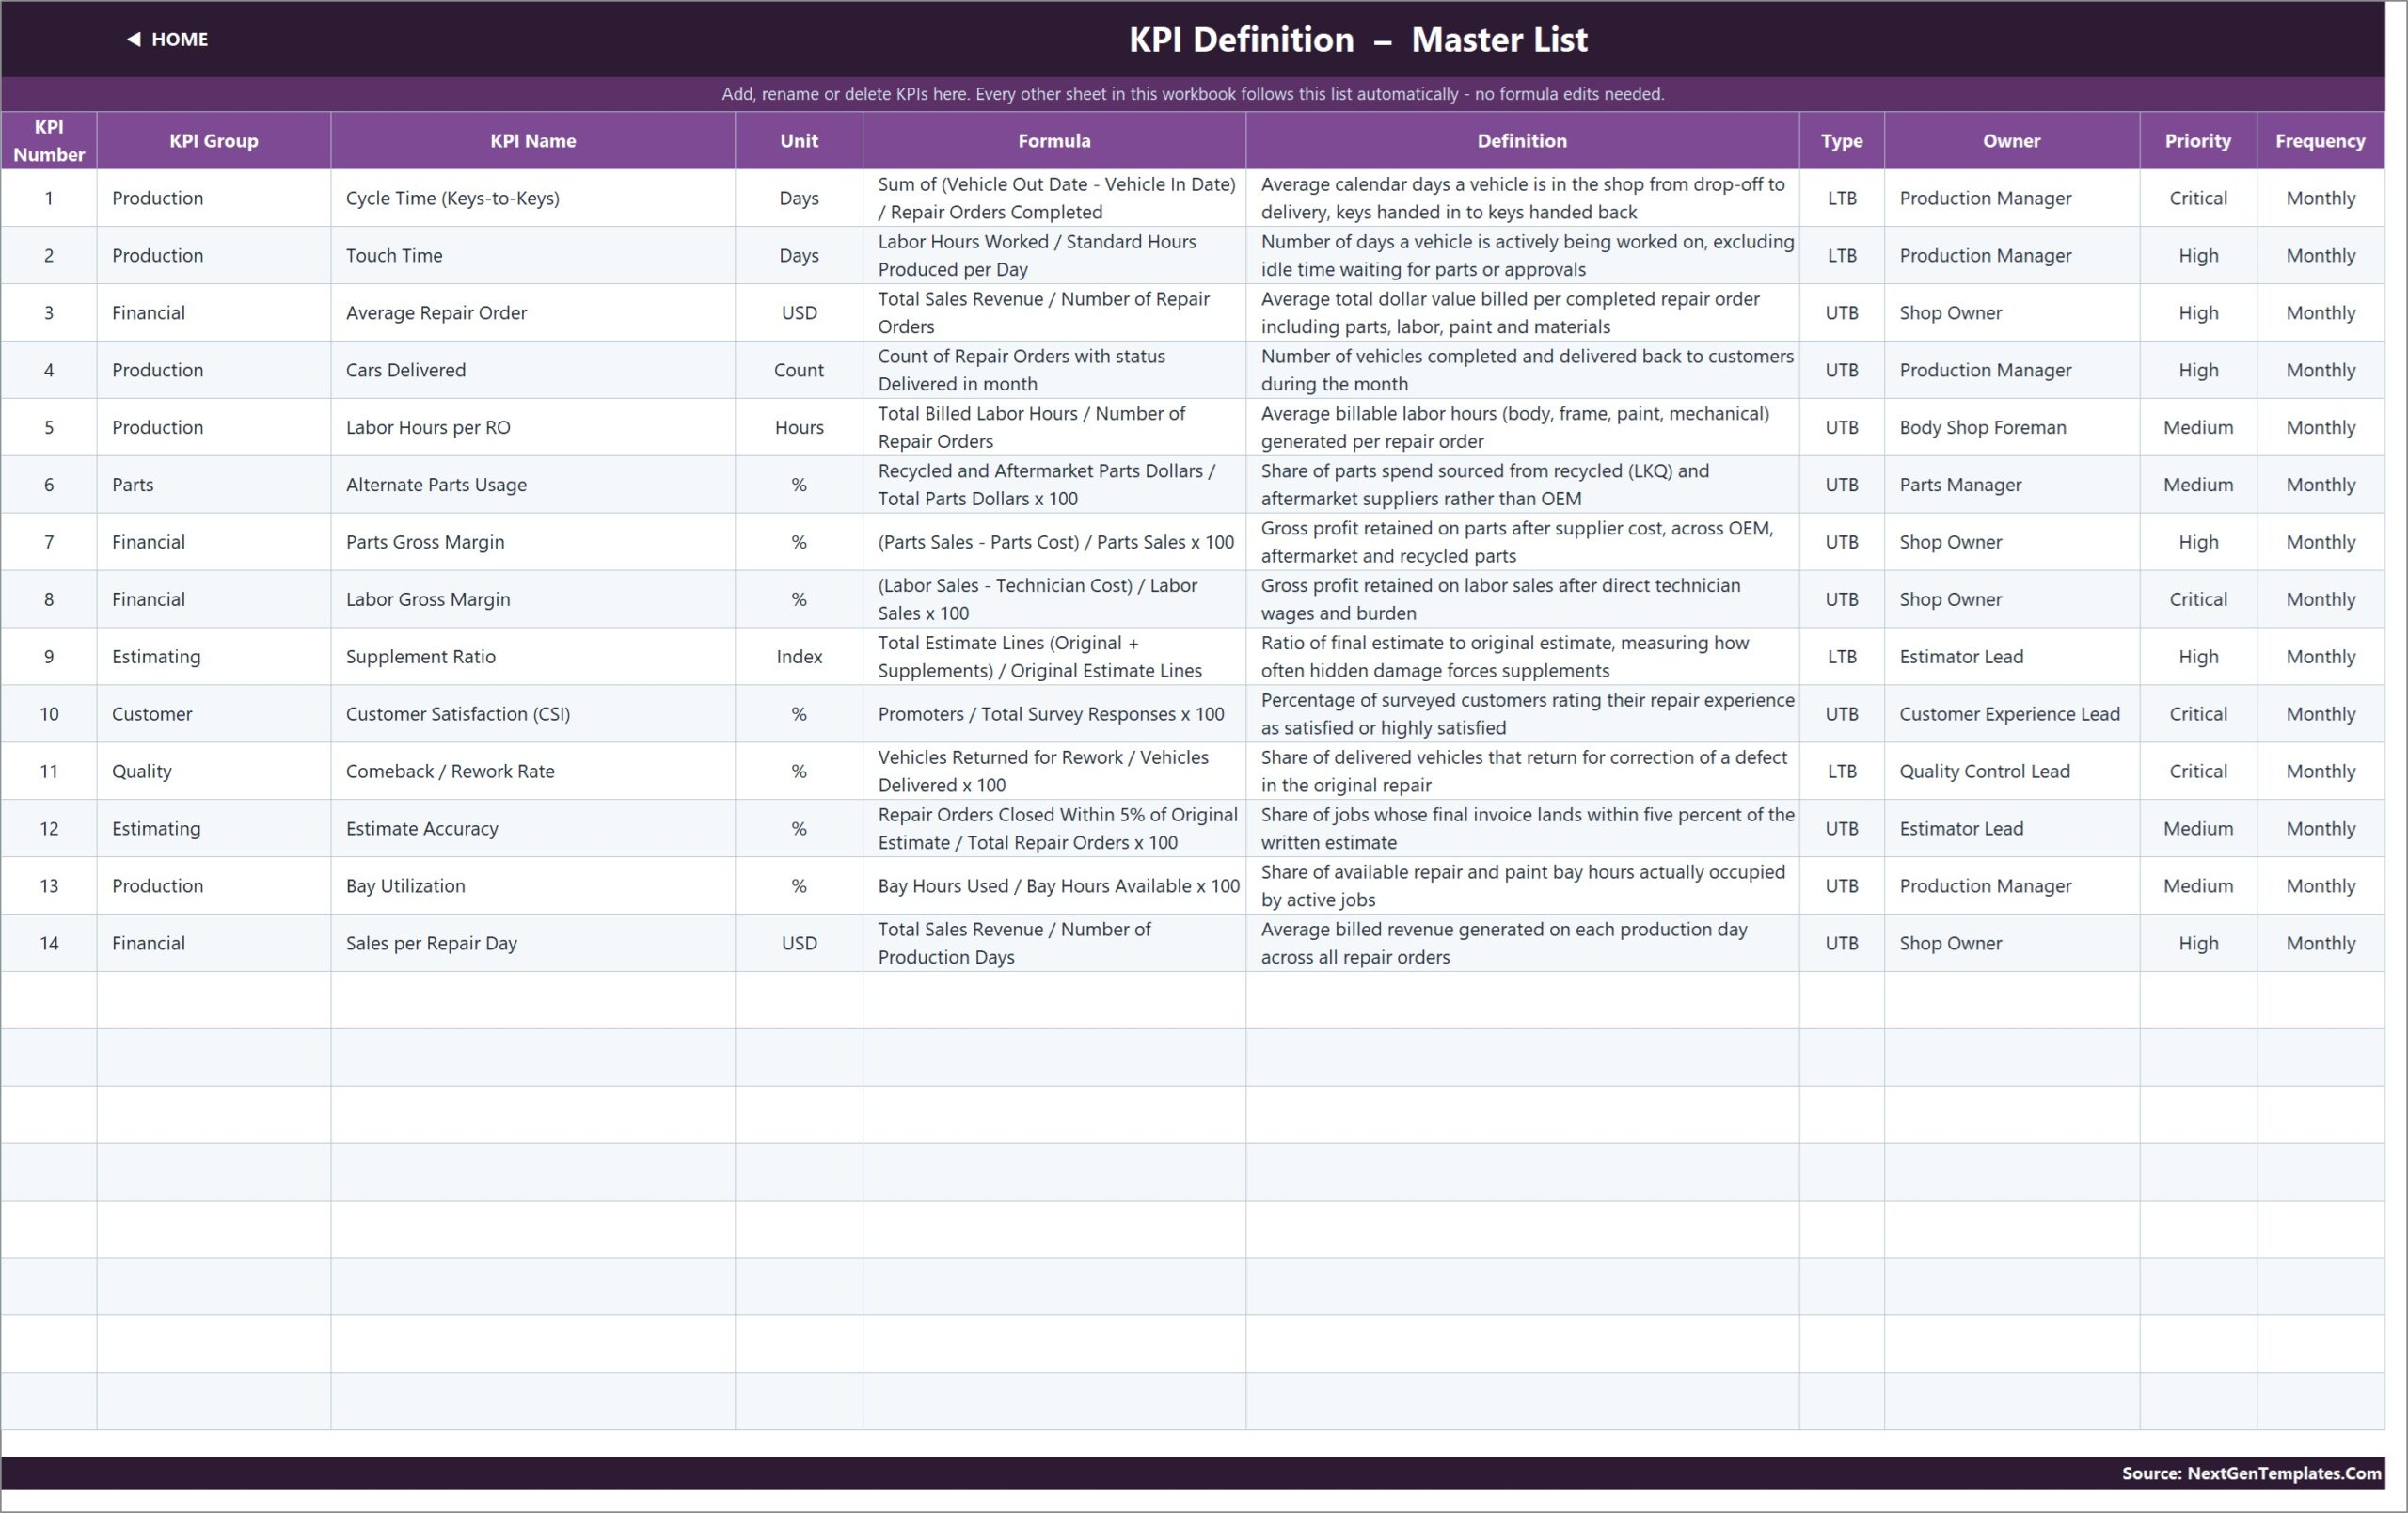
The master list stores KPI number, group, name, unit, formula, definition, type, owner, priority and frequency. Rename a KPI here and every other sheet follows. The Read Me sheet explains the rules, and Get More Templates links further templates.
This Excel KPI Dashboard vs. Google Sheets KPI Template vs. Body Shop Management Software — Feature Comparison
| Feature | This Excel dashboard | Google Sheets KPI template | Body shop management software |
|---|---|---|---|
| Cost | ✅ One-time purchase | One-time purchase | $100-400 per month |
| Platform | Microsoft Excel | Google Sheets | Vendor web app |
| Setup time | ✅ About 15 minutes | About 15 minutes | Days to weeks |
| Real-time team collaboration | Via OneDrive / SharePoint | ✅ Built in | ✅ Built in |
| Mobile access | Excel mobile app | ✅ Sheets app | ✅ Vendor app |
| Customizable KPIs | ✅ Up to 22 KPIs | Limited | Fixed report set |
| Share with link | Via OneDrive | ✅ Yes | User seats only |
| Year-1 cost at 5 users | ✅ One price, no seats | One price | $1,200-4,800+ |
| Automatic repair-order data capture | No, monthly values are typed | No | ✅ Yes |
For shops that want a monthly KPI review without another subscription, this Excel dashboard sits in the sweet spot.
Who Should Use This Template
Perfect for:
- Independent collision and auto body shop owners holding a monthly performance review
- Production managers who own cycle time, touch time and bay utilization
- Estimator leads watching Supplement Ratio and Estimate Accuracy
Not a fit if:
- You need numbers pulled automatically from estimating or shop management software; this workbook does not import from any system
- You want to track individual repair orders; the template works at monthly KPI level
Real-World Use Cases
Maria owns a 9-bay collision shop. On the first Monday of each month she types the previous month’s figures, selects the month and reads the seven cards. The Bottom 5 list tells her to start the team meeting with Supplement Ratio and comebacks rather than sales.
Dev is production manager for two shops. He keeps one copy of the workbook per location and uses KPI Trend on Touch Time and Bay Utilization to show which months the paint booth became the bottleneck.
Aisha is the shop’s estimator lead. She tracks Estimate Accuracy against target each month and uses the prior-year column to show whether fewer jobs now need supplements.
Advantages of This Template
- No recurring cost: one purchase, no per-user or per-location fees.
- Transparent formulas: VLOOKUP, MATCH, INDEX and COUNTIF only, so any Excel user can audit a number.
- Correct direction handling: lower cycle time, touch time, supplement ratio and comeback rate score as wins.
- Flexible KPI list: rename, add or remove KPIs on one sheet.
Opportunities for Improvement
- YTD is typed, not calculated. Each input sheet stores both MTD and YTD, so you must enter YTD yourself (a running total for Cars Delivered, a running average for rates). This gives control but adds data entry.
- Whole-number trend axis. The KPI Trend charts format the value axis without decimals, so a KPI with a narrow decimal range, such as YTD Cycle Time between 10.2 and 10.6 days, shows repeated tick labels (10, 10, 11, 11). Data labels and the table show the correct values.
- Direction choices are yours to confirm. Alternate Parts Usage is set to Upper The Better in the sample; change it in column G of KPI Definition if your shop sees it differently.
- Sample data is fictional and should be replaced before any review.
Best Practices
- Agree each KPI’s formula and owner on KPI Definition before entering data.
- Enter figures on a fixed day each month so the prior-year comparison stays like-for-like.
- Review the Bottom 5 first; it is ranked on YTD achievement, so it filters out one-month noise.
- Keep status thresholds consistent across locations if you run more than one shop. Microsoft’s guide to conditional formatting explains how the colours work.
- If you add KPIs, extend any dropdowns using data validation in Excel.
Explore Relevant Templates
For deeper analysis of repair transactions, read about the Auto Repair Dashboard in Excel, an analytical dashboard rather than a KPI scorecard. Dealership owners can look at the Car Dealership Dashboard in Excel, and a broader industry view is in the Automotive KPI Scorecard in Excel. Service businesses may also like the Appliance Repair Business KPI Dashboard in Excel, which uses the same month-picker design.
If your team works in Google Sheets, the Auto Body Shop KPI Scorecard in Google Sheets is a separate template with a different layout and its own KPI set, not a copy of this workbook.
Frequently Asked Questions
What does the Auto Body Shop KPI Dashboard in Excel measure?
It measures 14 body shop KPIs across Production, Financial, Estimating, Parts, Customer and Quality groups, including cycle time, touch time, average repair order, gross margins, supplement ratio, CSI and comeback rate, each MTD and YTD against target and prior year.
How long does setup take?
About 15 minutes for most shops. Set the first month in cell E3 on KPI Input – Actual, confirm the KPI list on KPI Definition, then type your MTD and YTD actuals, targets and prior-year values over the sample data.
Does the workbook use macros?
No. The workbook uses worksheet formulas only, with no macros, Power Query, data model or add-in, so it opens without a security warning.
How does this compare to body shop management software?
Management software records every repair order and charges a monthly fee. This workbook is a one-time purchase for monthly KPI review; it does not connect to any system, so monthly figures are typed in.
Can I change the KPIs?
Yes. Edit KPI Definition to rename, add or clear a KPI; the input sheets, dashboard, trend and analysis pages follow. The workbook is wired for 22 KPIs.
Why does a lower cycle time show above 100%?
Cycle Time is flagged Lower The Better, so achievement is Target ÷ Actual. Finishing faster than target therefore scores above 100%, just as beating a revenue target does.
About the Author
Built by PK — Microsoft Certified Professional with 15+ years of Excel, Google Sheets, and Power BI experience. Founder of NextGenTemplates, reaching 300K+ subscribers across YouTube channels. Every template is hand-built and tested before release.
Conclusion
This template gives a collision shop a clear monthly scorecard: 14 KPIs, MTD and YTD scoring, correct handling of lower-is-better metrics, a trend page and a group analysis, all in plain Excel.
👉 Click here to Purchase the Auto Body Shop KPI Dashboard in Excel
✅ Instant download · One-time payment · No subscription
🎥 Watch more tutorials at Youtube.com/@PK-AnExcelExpert
Last updated: September 2026