New: NextGenTemplates Academy - video courses on Excel formulas with AI and Pivot Tables & dashboards. Early-bird: 20% off with code EARLYBIRD20 - first 20 orders only. See the courses →
  • Learn Excel (Free Course)
    • 1. Shortcut Keys
    • 2. Fill & Flash Fill
    • 3. Find & Replace
    • 4. Sort & Filter
    • 5. Formulas & Functions
    • 6. Data Validation
    • 7. Conditional Formatting
    • 8. Basic Charts
    • 9. Advanced Charts
    • 10. Pivot Tables
    • 11. Excel Dashboards
    • 12. VBA Course
    • 13. Excel Formulas with AI
  • Templates
  • Tutorials
    • Charts and Visualization
    • VBA
    • Excel Tips and Tricks
    • Excel Dashboards
    • Power Pivot & DAX
  • Power BI
  • Template Store
    • Ready to Use Templates
  • Courses
  • Academy
    • Excel + AI Mastery: 100 Formulas
    • Excel Pivot Tables & Dashboards
  • About Us
  • Contact Us

PK: An Excel Expert

Transforming Data into Decisions
Tag: Power BI Template

Dashboard Power BI Templates

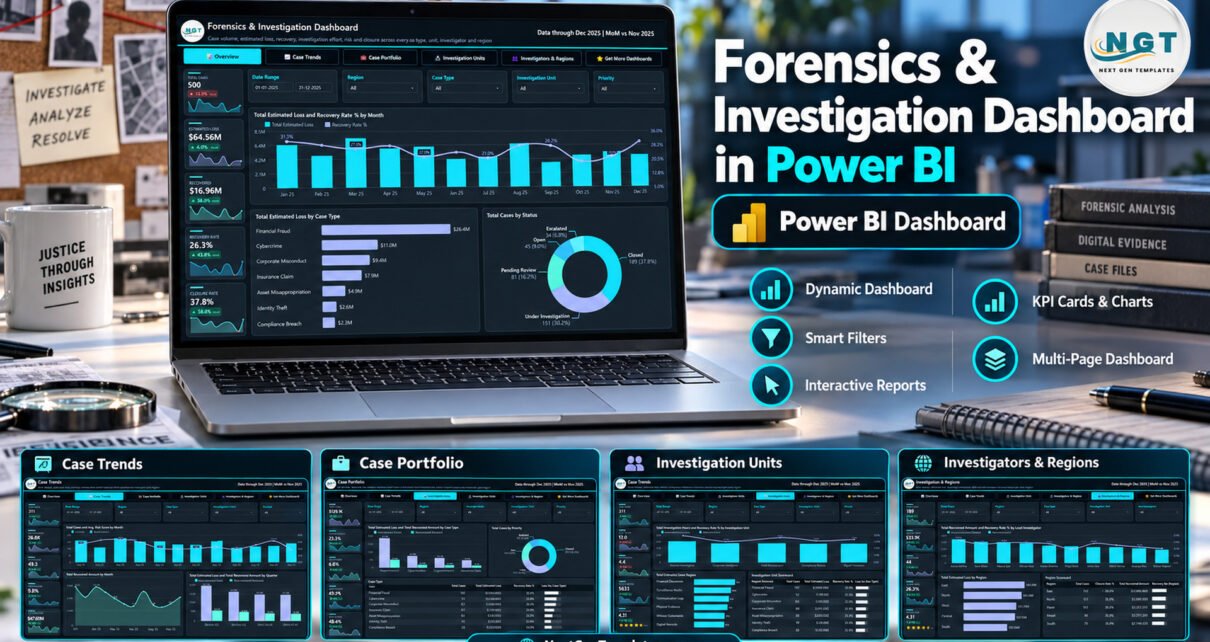
Forensics & Investigation Dashboard in Power BI

September 28, 2026September 28, 2026 PKComments Off on Forensics & Investigation Dashboard in Power BI
The Forensics and Investigation Dashboard in Power BI is a five-page .pbix report built over a sample book of 500 cases spanning January to December 2025. It carries 25 KPI
Read More
Dashboard Power BI Templates

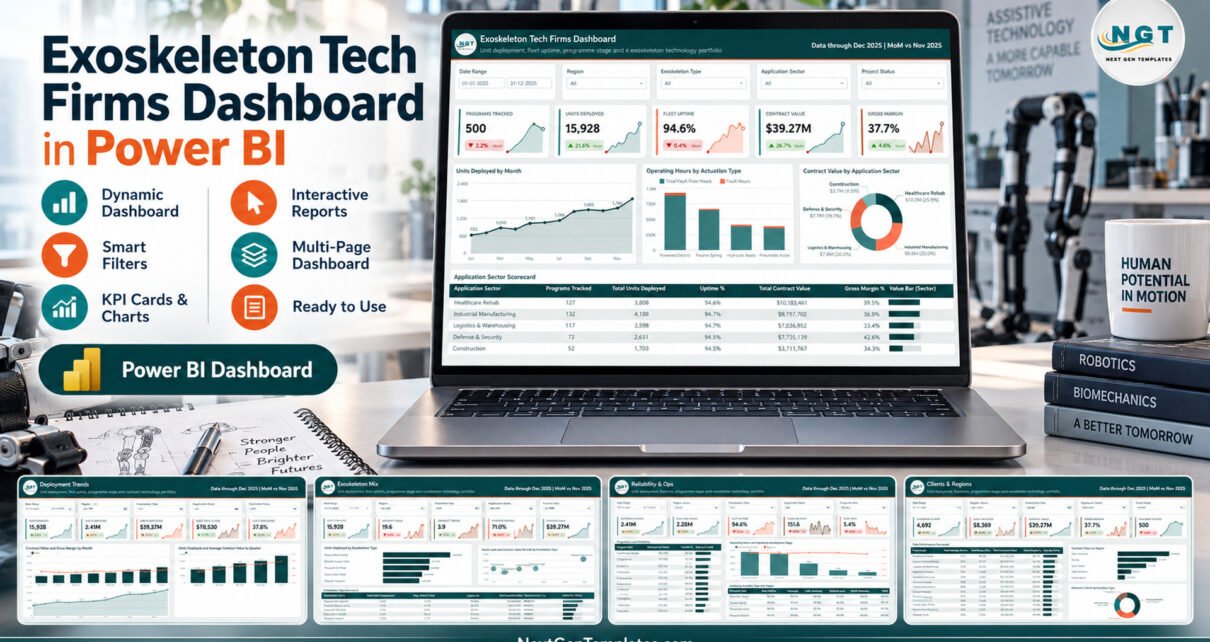
Exoskeleton Tech Firms Dashboard in Power BI

September 21, 2026September 21, 2026 PKComments Off on Exoskeleton Tech Firms Dashboard in Power BI
The Exoskeleton Tech Firms Dashboard in Power BI is a ready-made .pbix report. It turns 500 programme records into 5 analysis pages, 25 KPI cards and 16 charts and tables.
Read More
Power BI Templates

Documentary Channels Dashboard in Power BI

September 11, 2026September 11, 2026 PKComments Off on Documentary Channels Dashboard in Power BI
The Documentary Channels Dashboard in Power BI reports on a 500-title, 1,955-episode catalog across 5 interactive report pages, 15 charts and scorecards, and 22 DAX measures, with 5 slicers available
Read More
Dashboard Power BI Templates

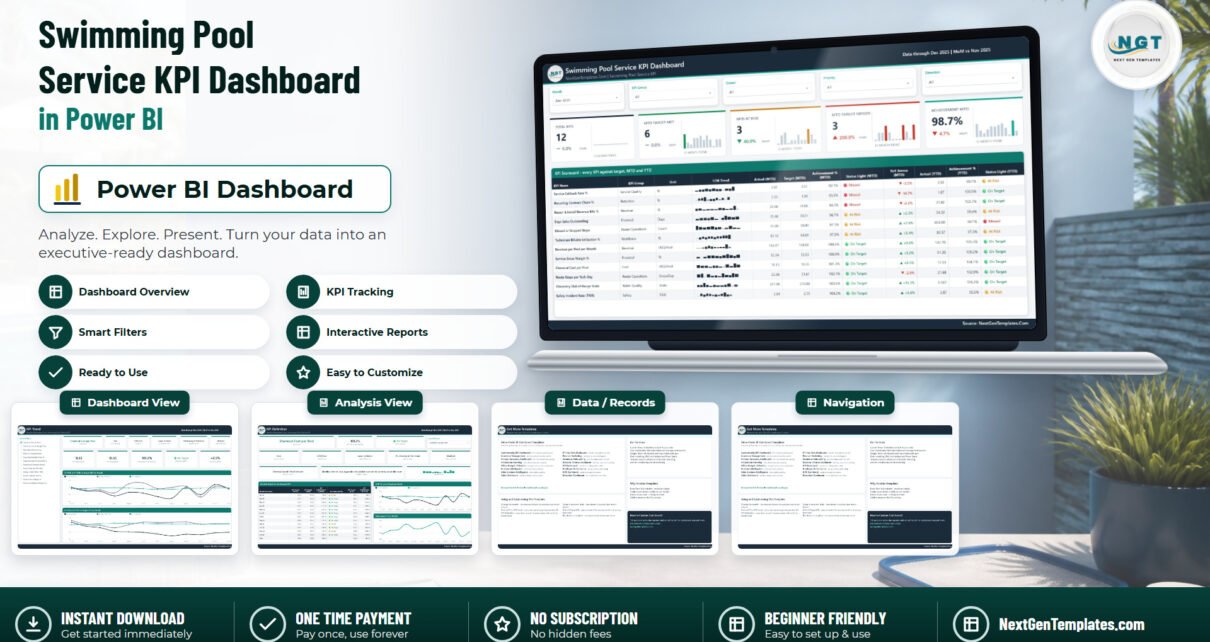
Swimming Pool Service KPI Dashboard in Power BI

September 8, 2026September 8, 2026 PKComments Off on Swimming Pool Service KPI Dashboard in Power BI
Most pool-service reporting stops at a totals sheet. Stops completed, chemicals bought, invoices raised - real numbers, but nothing in them says whether the month was good. The Swimming Pool
Read More
Power BI Templates

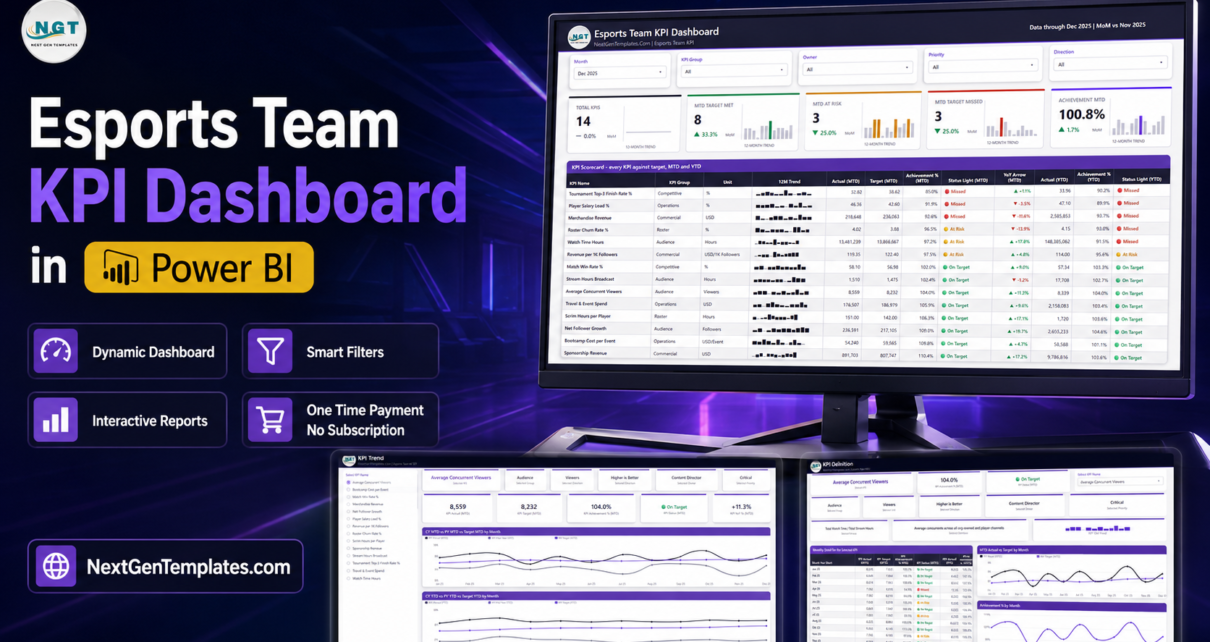
Esports Team KPI Dashboard in Power BI

August 27, 2026August 27, 2026 PKComments Off on Esports Team KPI Dashboard in Power BI
Running an esports organisation means answering three different questions in the same meeting. Did we win? Is anyone watching? Are we making money? Most orgs answer them in three different
Read More
Power BI Templates

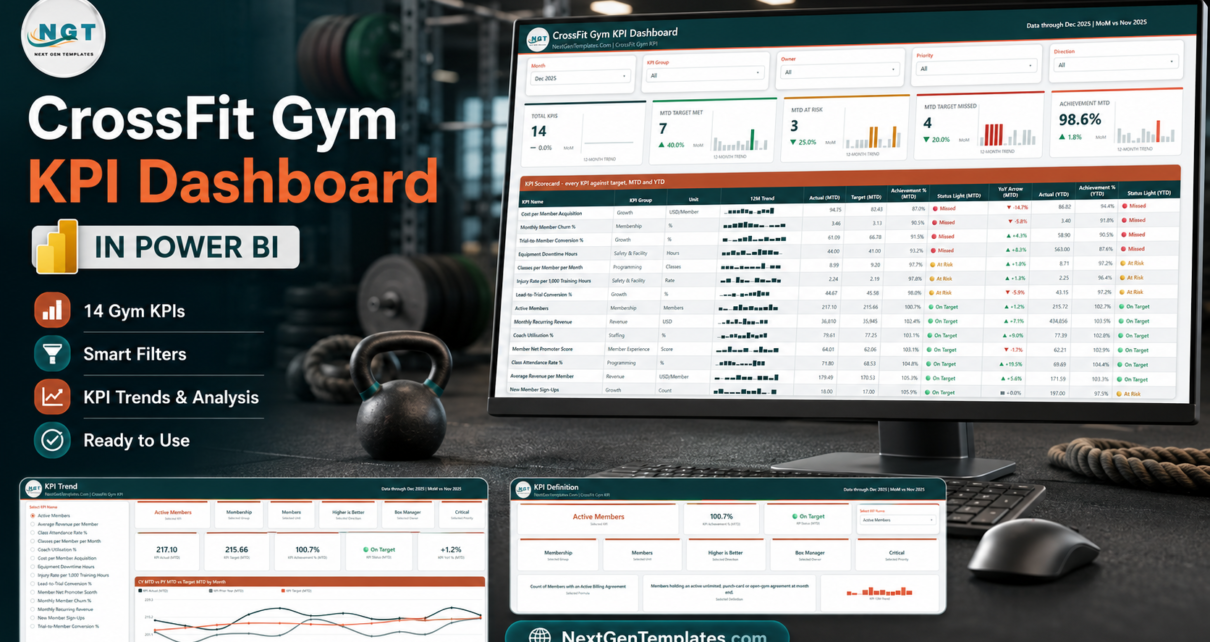
CrossFit Gym KPI Dashboard in Power BI

August 26, 2026August 26, 2026 PKComments Off on CrossFit Gym KPI Dashboard in Power BI
Most CrossFit affiliates measure the same three things - members, revenue and how full the 6am class is - and then argue about everything else from memory. The CrossFit Gym
Read More
Power BI Templates

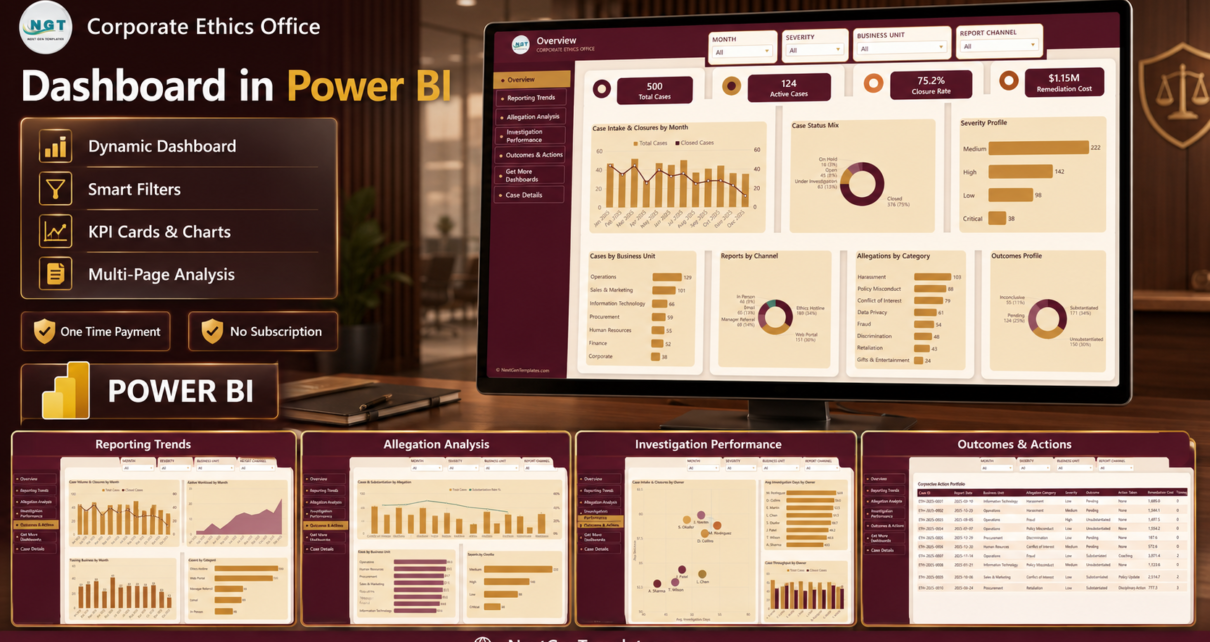
Corporate Ethics Office Dashboard in Power BI

August 26, 2026August 26, 2026 PKComments Off on Corporate Ethics Office Dashboard in Power BI
Most ethics offices have the data. What they do not have is a way to show it. Cases land through a hotline, a web portal, a manager referral and an
Read More
Power BI Templates

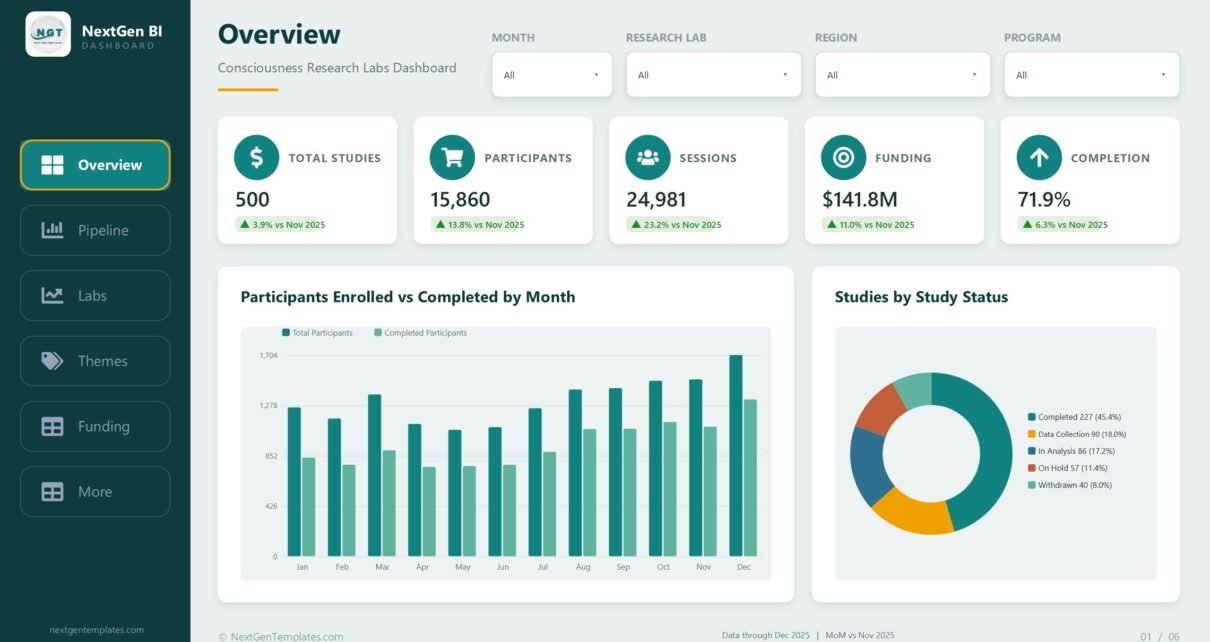
Consciousness Research Labs Dashboard in Power BI

August 25, 2026August 25, 2026 PKComments Off on Consciousness Research Labs Dashboard in Power BI
A consciousness research group is an operations problem before it is a science problem. Studies sit in five different statuses at once, participants drop out between screening and completion, EEG
Read More
Power BI Templates

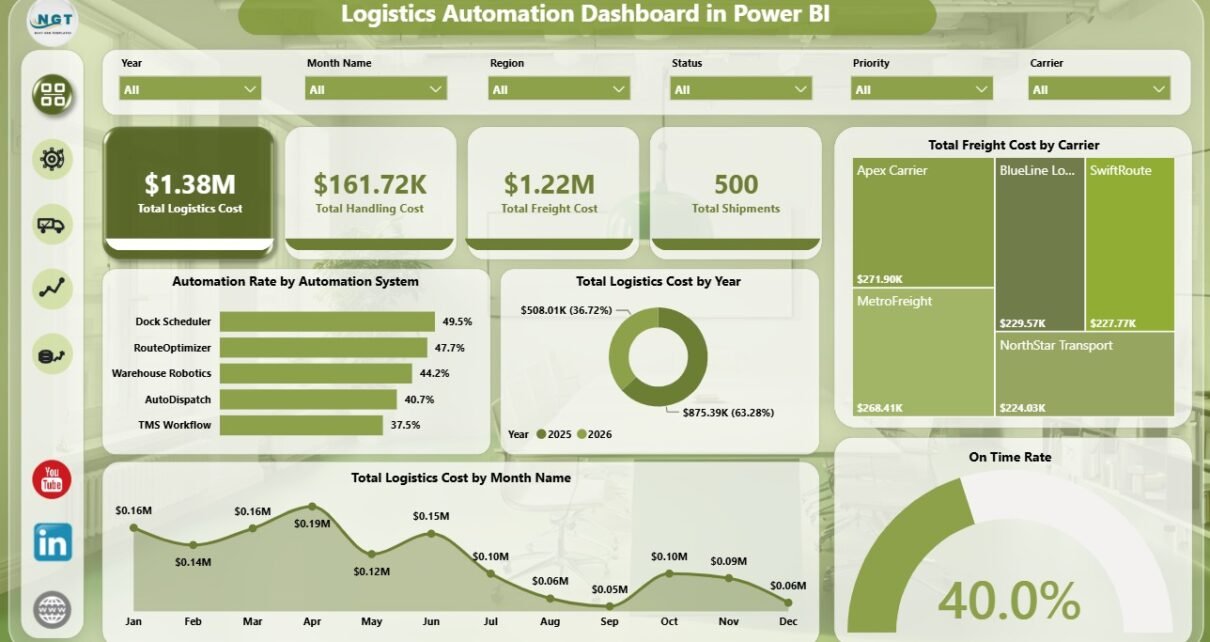
Logistics Automation Dashboard in Power BI

July 4, 2026July 4, 2026 PK0
Logistics Automation Dashboard in Power BI is a ready-to-use PBIX report for logistics managers, carrier operations teams, warehouse leaders, transportation coordinators, and supply chain analysts who need a clear view
Read More
Power BI

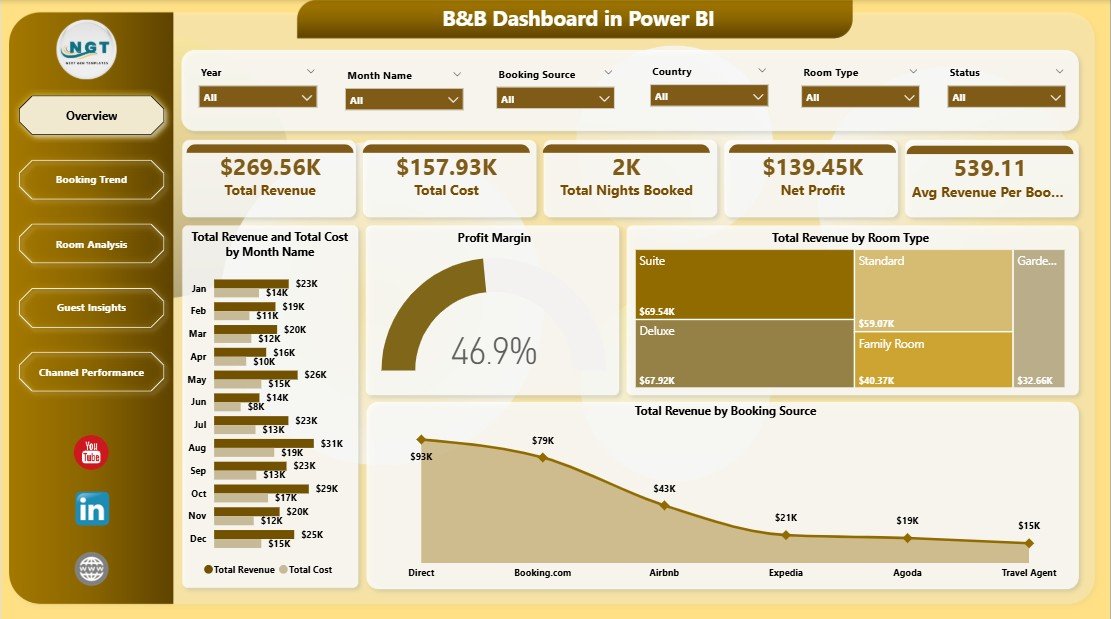
B&B Dashboard in Power BI

April 28, 2026April 28, 2026 PKComments Off on B&B Dashboard in Power BI
The B&B Dashboard in Power BI tracks 5 high-level KPIs and 13 visuals across 5 interactive report pages, with multiple slicers for booking source, room type, guest type, country, and
Read More

Posts pagination

1 2 … 9 Next
  • Learn Excel (Free Course)
    • 1. Shortcut Keys
    • 2. Fill & Flash Fill
    • 3. Find & Replace
    • 4. Sort & Filter
    • 5. Formulas & Functions
    • 6. Data Validation
    • 7. Conditional Formatting
    • 8. Basic Charts
    • 9. Advanced Charts
    • 10. Pivot Tables
    • 11. Excel Dashboards
    • 12. VBA Course
    • 13. Excel Formulas with AI
  • Templates
  • Tutorials
    • Charts and Visualization
    • VBA
    • Excel Tips and Tricks
    • Excel Dashboards
    • Power Pivot & DAX
  • Power BI
  • Template Store
    • Ready to Use Templates
  • Courses
  • Academy
    • Excel + AI Mastery: 100 Formulas
    • Excel Pivot Tables & Dashboards
  • About Us
  • Contact Us
Copyright © 2023 PK-AnExcelExpert.com - Privacy Policy