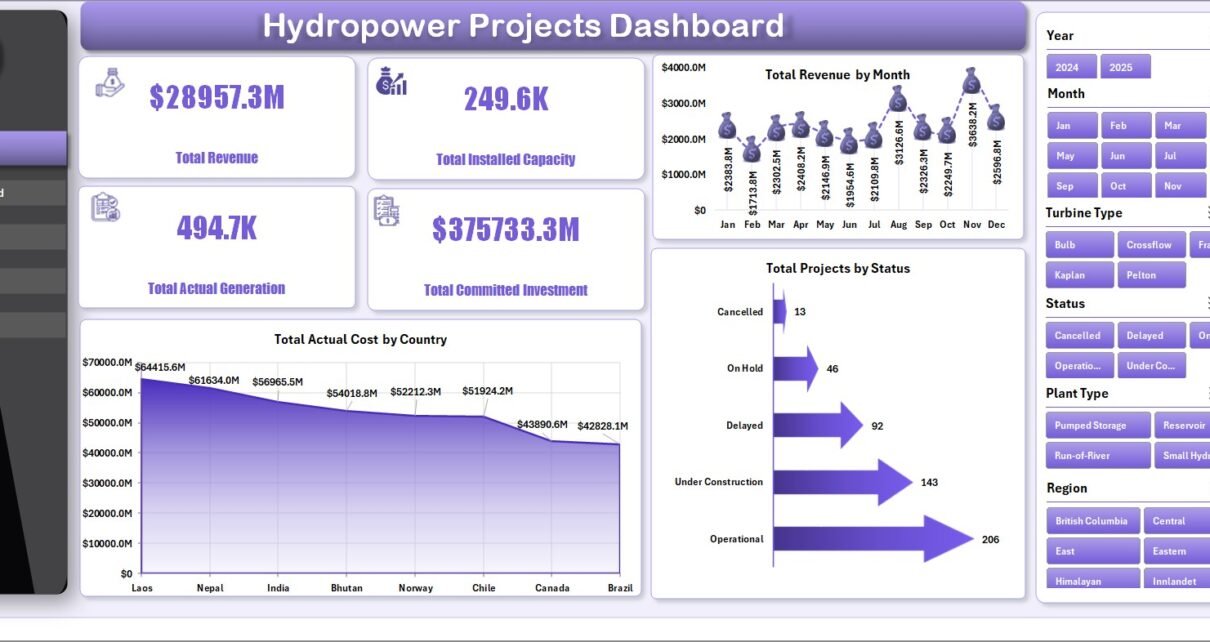
• Advanced Excel
    • Shortcut Keys
    • Useful Formulas
    • Basic Charts
    • Advanced Chart
    • Sort and Filter
    • Pivot Table
    • Data Validation
    • Conditional Formatting
    • Auto Fill and Flash Fill
    • Find and Replace
  • VBA Course
  • Products
    • Restaurant Management
    • PK’s Utility Tool V2.0
    • PK’s Utility Tool V1.0
    • Task Management
    • AMS V1.0
    • AMS V2.0
    • Sale/Purchase Software
    • PK’s Function Kit
  • Blogs
    • Charts and Visualization
    • VBA
    • Excel Tips and Tricks
    • Templates
  • Excel Dashboard
    • Sales Dashboard
    • Process Dashboard
    • Performance Dashboard
    • Project Management
    • Outbound Dashboard
    • Incentive Dashboard
    • Zonal Dashboard in Excel
    • Quick Dashboard
  • Free Templates
  • Power BI
  • About Us
  • Contact Us

PK: An Excel Expert

Excel, VBA and Power BI tutorials

Dashboard

Daily Sales Dashboard
Dashboard

Daily Sales Dashboard in Excel

April 5, 2022April 5, 2022 PKComments Off on Daily Sales Dashboard in Excel
Dashboard

Annual Sales Calendar for Sales Dashboard in Excel

September 5, 2021September 5, 2021 PKComments Off on Annual Sales Calendar for Sales Dashboard in Excel
Comparative Analysis Dashboard in Excel
Dashboard Power Pivot

Comparative Analysis Dashboard in Excel

June 20, 2021June 20, 2021 PKComments Off on Comparative Analysis Dashboard in Excel
Hourly Project Planner
Charts and Visualization Dashboard

Dynamic Hourly Project Planner (Gantt Chart)

December 27, 2020December 27, 2020 PKComments Off on Dynamic Hourly Project Planner (Gantt Chart)
Top-Bottom Analysis in Excel
Charts and Visualization Dashboard

Top/Bottom Analysis dashboard in Excel

May 24, 2020May 24, 2020 PKComments Off on Top/Bottom Analysis dashboard in Excel
Tablet and Mobile layout Dashboard
Dashboard

Dynamic Dashboard with Tablet and Mobile shape in Excel

May 17, 2020May 17, 2020 PKComments Off on Dynamic Dashboard with Tablet and Mobile shape in Excel
Excel Dashboard With Multiple Source Files
Dashboard Power Pivot

Fully Automated Excel dashboard with multiple source files

April 12, 2020April 12, 2020 PKComments Off on Fully Automated Excel dashboard with multiple source files
Northwind Dashboard
Dashboard Power BI

Beautiful Power BI Dashboard with Northwind Database

March 24, 2020June 30, 2020 PKComments Off on Beautiful Power BI Dashboard with Northwind Database

Top Categories

  • Charts and Visualization (126)
  • Dashboard (8)
  • Excel Tips and Tricks (53)
  • Power BI (19)
  • Power Pivot (14)
  • Power Point Visualization (5)
  • Predictive Analytics (3)
  • Templates (49)
  • VBA (75)

Read More about..

  • Advanced Excel
  • VBA Course
  • Dashboard
  • Chart and Visualization
  • VBA Tips
  • Excel Tips and Trics
  • Our Excel Products
  • About US
  • Contact Us


Subscribe to our Newsletter


Download Free Dashboards

  • Project Management Dashboard
  • Zonal Dashboard
  • Sales Dashboard
  • Outbound Dashboard
  • A Quick Dashboard
  • C-SAT Dashboard
  • Performance Dashboard
  • Process Dashboard
  • Incentive Dashboard

Recent Posts

  • How Chat GPT can help to write Complex Excel Function, VBA code and DAX for Power BI
  • Power BI dashboard with 3D Glass Chart
  • Use of Symbols and Emojis in Excel Drop-down List and Excel Charts
  • Five awesome formulas in Excel
  • Quick 3D Container chart in Excel
  • TEXTSPLIT function with three use cases in Excel
  • LAMBDA Function in Excel with Example
  • Data Transformation to create Comma Separated List automatically
  • Inventory Management Template for Multiple Locations
  • Paste Special in Microsoft Excel
Copyright © 2018 PK-AnExcelExpert.com - Privacy Policy