Gaming and esports teams are managing more commercial data than ever: tournament revenue, sponsor tiers, platform performance, regional viewership, streaming hours, player segments, and event completion status. A single esports calendar can produce hundreds of rows of operational and financial data, yet many analysts still rebuild weekly reports manually. The Gaming Esports Dashboard in Excel solves that problem with a ready-to-use workbook containing 5 analytical pages, 5 headline KPI cards, 17 chart views, slicers, a structured Data sheet, and a pivot-powered Support sheet.
This template is designed for Excel users who want fast business visibility without buying a subscription analytics platform. Replace the sample rows, keep the same data structure, click Data > Refresh All, and the dashboard pages update through pivot tables and charts. You can also learn more about Excel refresh workflows from Microsoft Support.
Gaming Esports Dashboard in Excel
Key Features of Gaming Esports Dashboard in Excel
The workbook is built around practical esports reporting questions: How much revenue did we generate? Which tournaments cost the most? Which game titles have stronger profit margins? Which regions and platforms bring the most audience? Which sponsor tiers are most profitable?
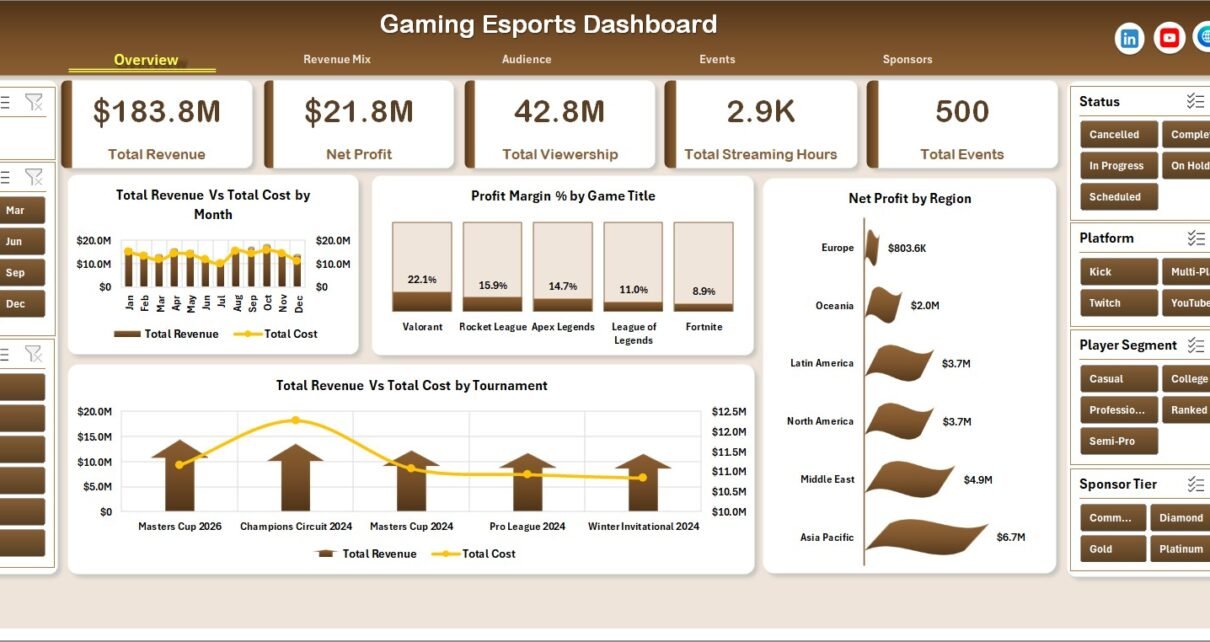
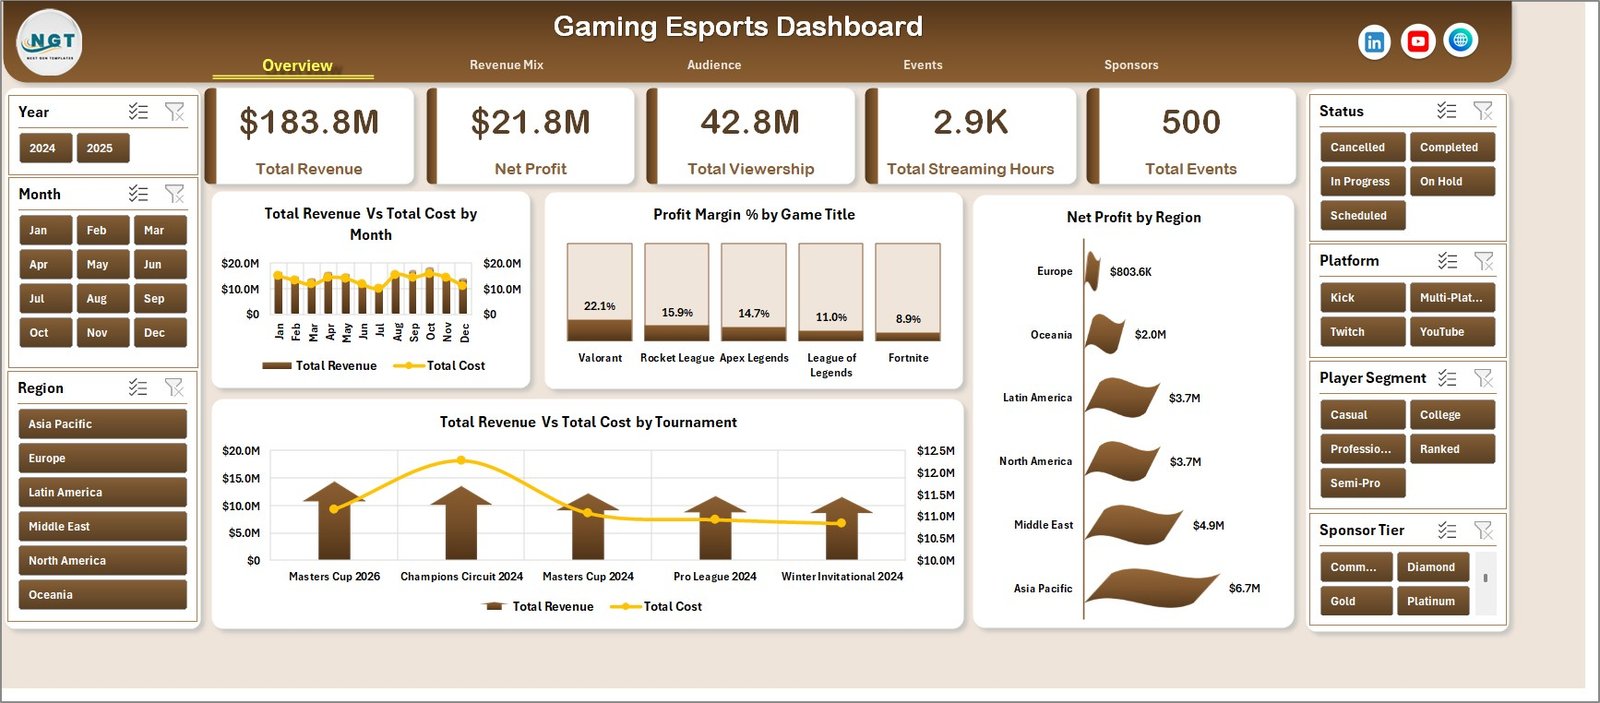
The top-level cards show Total Revenue, Net Profit, Total Viewership, Total Streaming Hours, and Total Events. These cards give decision-makers a quick summary before they inspect the supporting charts. Slicers make the report interactive, so users can filter the dashboard by available fields in the data model instead of editing formulas manually.
Dashboard Pages Explanation
1 – Overview Page
The Overview page is the executive summary. It shows five KPI cards for Total Revenue, Net Profit, Total Viewership, Total Streaming Hours, and Total Events, followed by charts that explain revenue, cost, profit margin, and tournament performance.
Total Revenue Vs Total Cost by Month: This chart helps you compare revenue and spending month by month. It makes it easier to identify periods where event activity increased cost faster than revenue.
Profit Margin % by Game Title: This chart shows which game titles produce better margins. Use it to prioritize profitable titles for future tournaments, sponsorship packages, or streaming campaigns.
Net Profit by Region: This view compares profitability across regions. It helps teams see where audience, sponsorship, and event economics are strongest.
Total Revenue Vs Total Cost by Tournament: This chart compares tournament-level financial performance. It helps event managers identify high-return tournaments and expensive events that need review.
Overview Page
2 — Revenue Mix
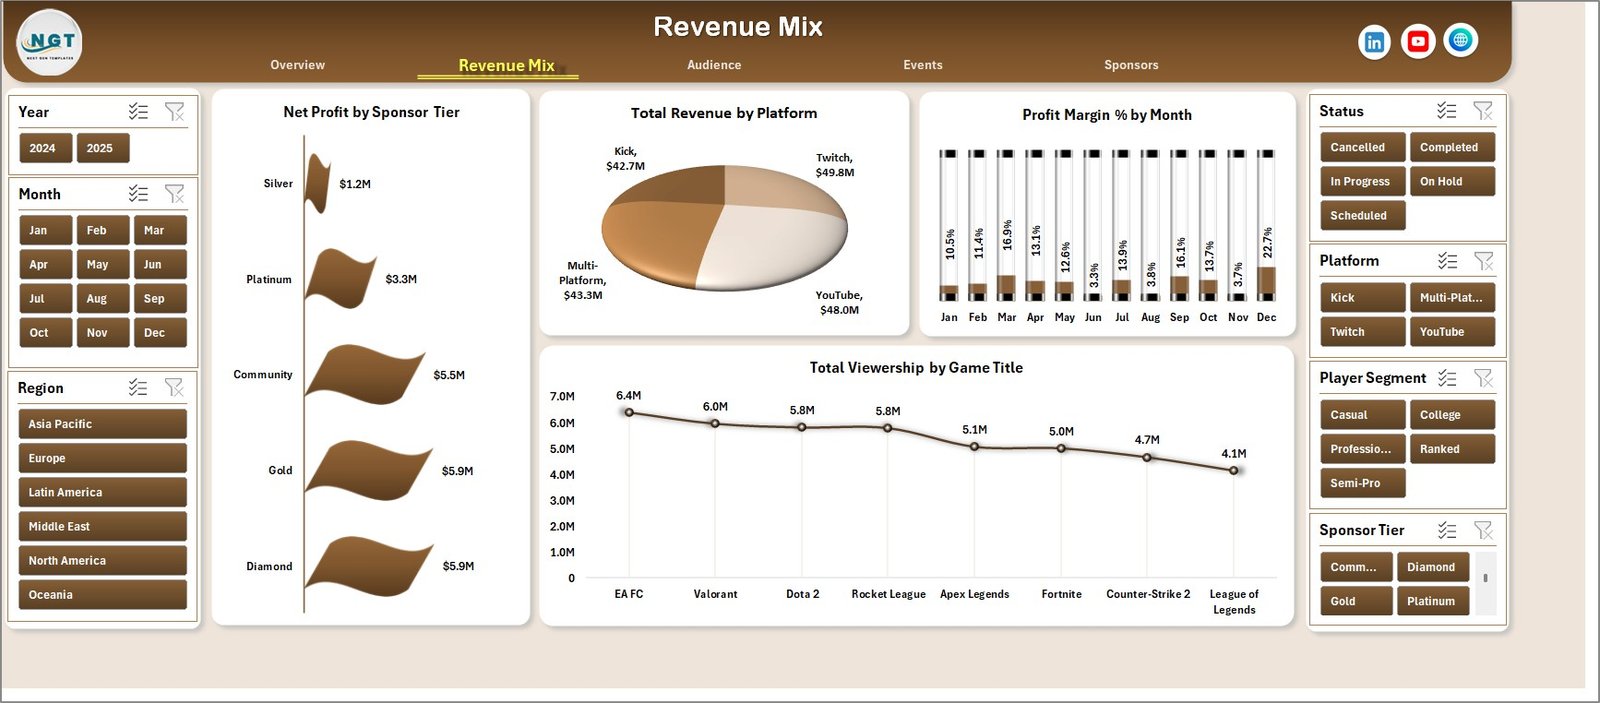
The Revenue Mix sheet focuses on monetization. It helps you understand how sponsor tiers, platforms, months, and game titles contribute to the overall esports business model.
Net Profit by Sponsor Tier: This chart compares profitability across sponsor levels. It shows whether premium tiers are producing enough net return after event and delivery costs.
Total Revenue by Platform: This chart ranks platforms by revenue contribution. It is useful for comparing streaming channels, distribution platforms, or campaign sources.
Profit Margin % by Month: This chart highlights monthly margin movement. It helps managers spot seasonal cost pressure or stronger monetization periods.
Total Viewership by Game Title: This chart connects game titles with audience demand. It helps content and tournament teams understand which titles attract the strongest viewership.
Revenue Mix
3 — Audience
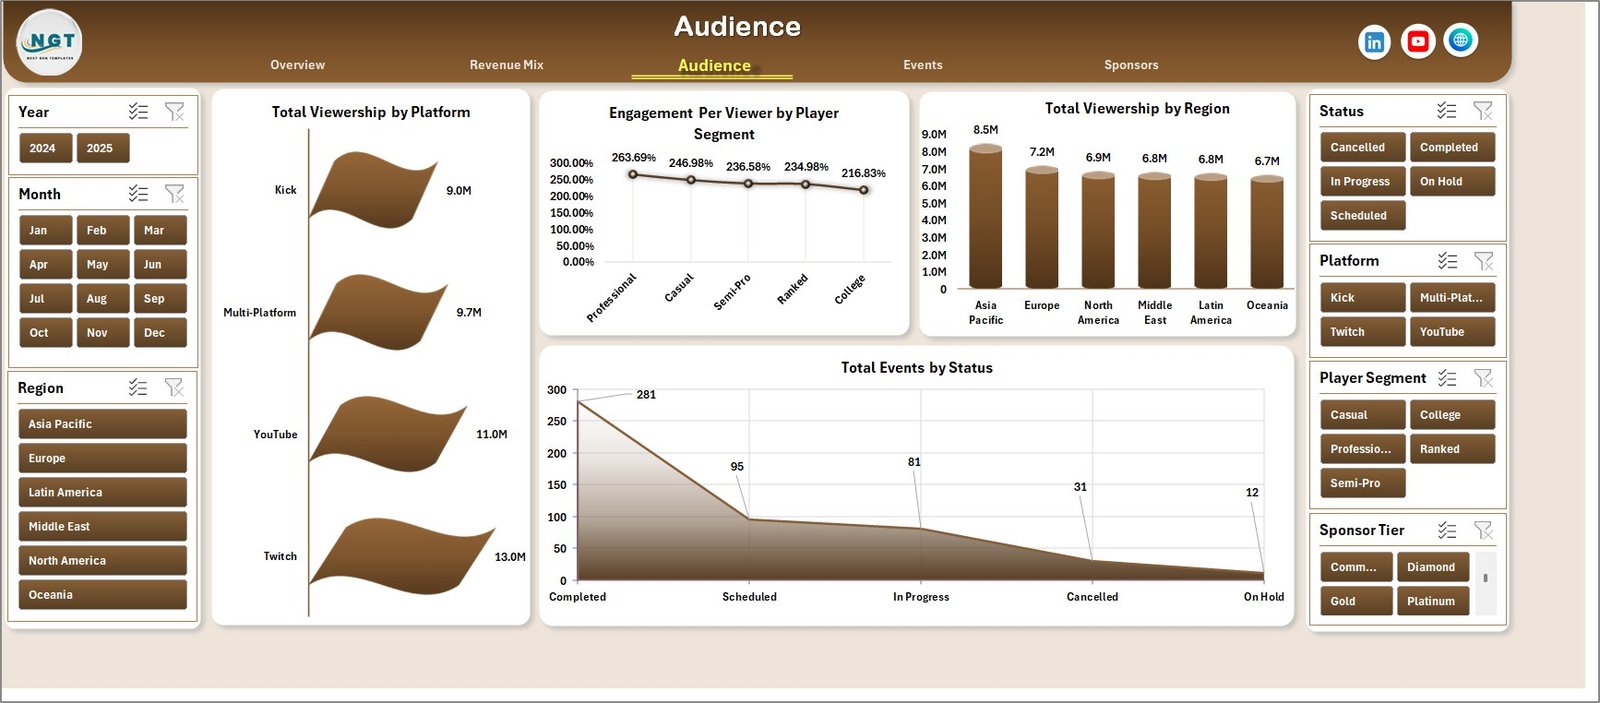
The Audience page turns viewership and engagement data into a clear report. It is especially useful for streamers, community managers, sponsorship teams, and agencies reporting campaign performance.
Total Viewership by Platform: This chart shows where most viewers are coming from. It helps teams decide which platforms deserve more content investment.
Engagement Per Viewer by Player Segment: This chart measures engagement quality across player or audience segments. It helps identify the segments that interact more deeply with esports content.
Total Viewership by Region: This chart compares regional audience demand. It helps with market planning, localized campaigns, and sponsorship targeting.
Total Events by Status: This chart shows the distribution of events by status. It helps operations teams monitor completed, planned, cancelled, or active events.
Audience
4 — Events
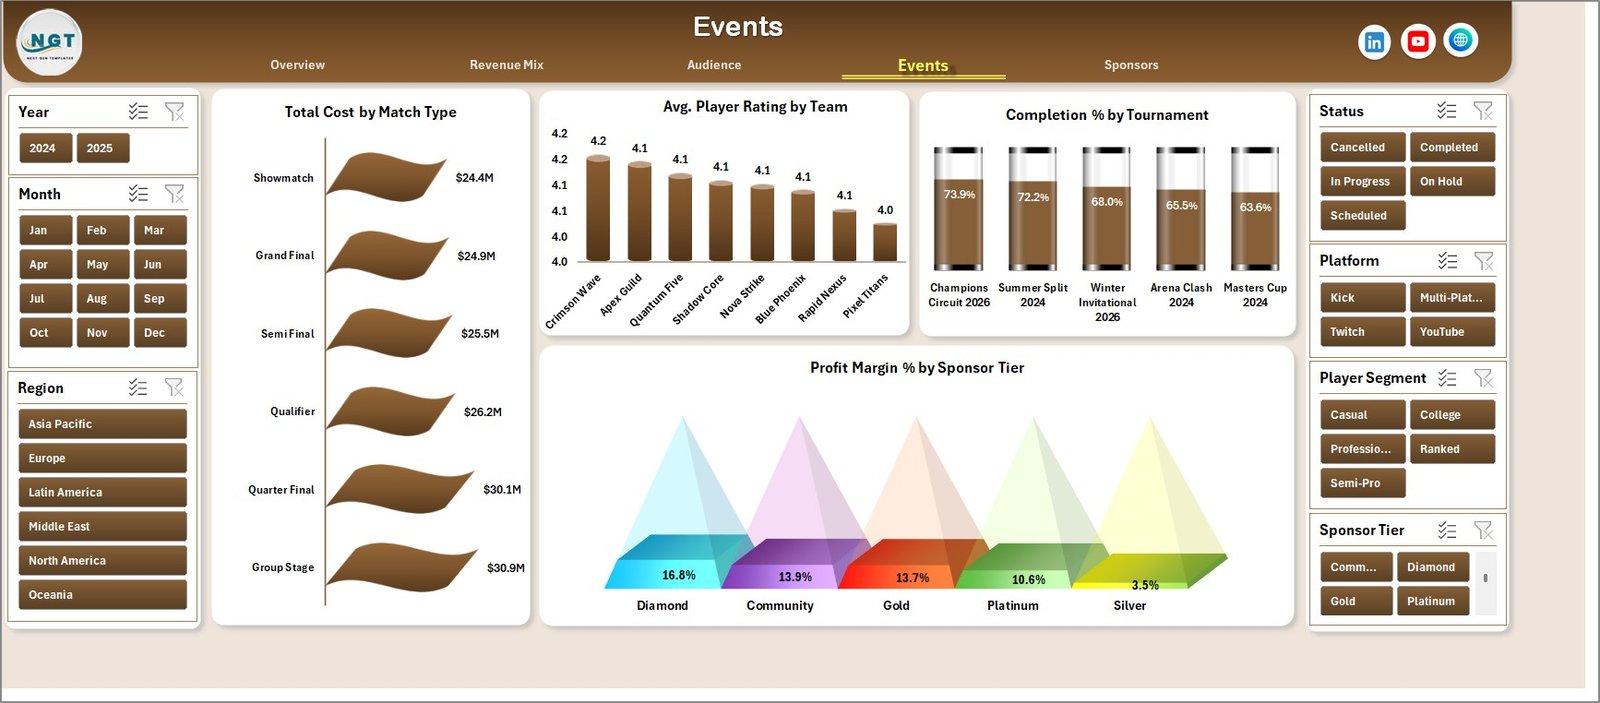
The Events page is built for tournament and operations review. It combines match type cost, team performance, tournament completion, and sponsor tier margin into one focused sheet.
Total Cost by Match Type: This chart shows which match formats consume the most budget. Use it to control event cost and compare match formats before planning the next schedule.
Avg. Player Rating by Team: This chart compares team-level performance quality. It helps analysts identify stronger teams and teams needing performance review.
Completion % by Tournament: This chart tracks tournament progress. It is useful for operations reporting when multiple tournaments are running in parallel.
Profit Margin % by Sponsor Tier: This chart links sponsor tier performance with profitability. It helps commercial teams evaluate whether sponsor packages are priced correctly.
Events
5 — Sponsors
The Sponsors page helps business and partnership teams review revenue, cost, platform performance, and game-title profitability. It is useful for sponsorship renewals, sponsor reporting, and commercial planning.
Total Revenue Vs Total Cost by Region: This chart compares regional economics. It helps identify where sponsor and event activity creates the best financial outcome.
Net Profit by Game Title: This chart shows game-level profitability. It helps teams understand whether popular games are also financially productive.
Total Revenue Vs Total Cost by Platform: This chart compares platform-level revenue and cost. It helps decide where to focus streaming, marketing, and sponsor activation.
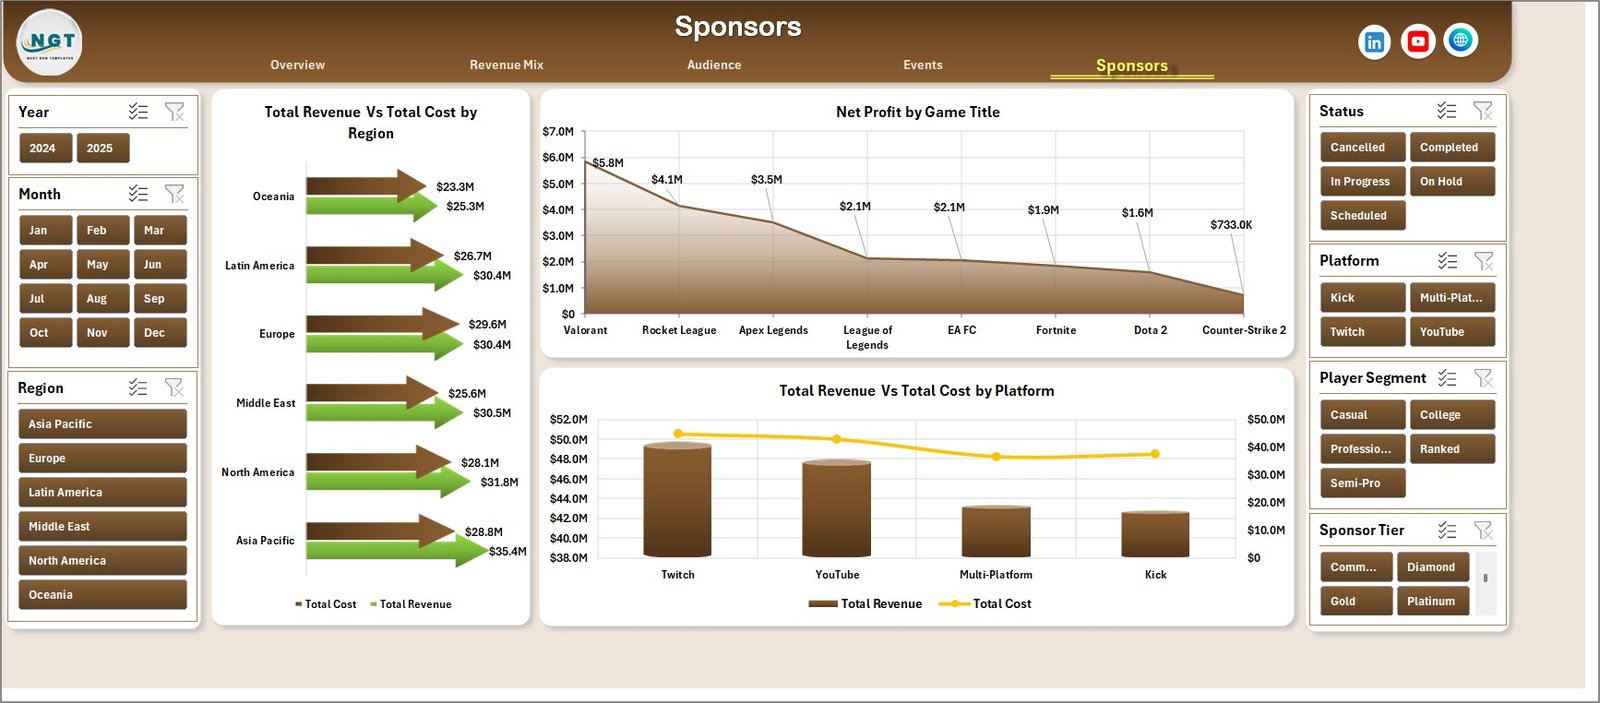
Sponsors
6 – Data Sheet Tab
The Data sheet is where you add the data in the same format as the sample records. Keep the column names and structure consistent so the dashboard charts, cards, slicers, and pivot tables continue to work correctly.

Data Sheet tab
7 – Support Sheet
The Support sheet contains the pivot tables used to build the dashboard dynamically. After updating the Data sheet, go to the Data tab in the Excel Ribbon and click Refresh All. The pivots and dashboard charts will refresh. You can keep this sheet hidden during normal use.

Support sheet tab
Gaming Esports Dashboard in Excel vs. Google Sheets vs. Paid Esports SaaS – Feature Comparison
| Feature | Gaming Esports Dashboard in Excel | Google Sheets Alternative | Paid Esports SaaS |
|---|---|---|---|
| Cost | $17.99 one-time | Template or workspace cost | Monthly or annual subscription |
| Platform | Microsoft Excel | Google Sheets | Vendor cloud platform |
| Setup time | Replace data and refresh | Copy template and configure sharing | Vendor onboarding |
| Real-time team collaboration | Possible through OneDrive or SharePoint | Native browser collaboration | Vendor controlled |
| Mobile access | Excel mobile or shared workbook | Google Sheets mobile | Vendor app or mobile web |
| Customizable fields | Editable workbook | Editable sheet | Limited by vendor plan |
| Share with link | Yes with cloud storage | Yes | Usually yes |
| Year-1 cost at 5 users | $17.99 total | Usually low if using existing account | Often hundreds or thousands per year |
| Pivot-based refresh | Yes | Depends on formulas | Vendor managed |
| Offline use | Yes | Limited | No or limited |
Who Should Use This Template
This template is a good fit for esports teams, tournament organizers, gaming agencies, sponsorship managers, streaming analysts, content teams, and Excel users who need a practical reporting workbook. It is also useful for consultants who prepare monthly esports performance reports for clients.
It is not the right tool if you need live API ingestion, real-time match telemetry, automated betting odds, broadcast production control, anti-cheat monitoring, or video review workflows. Those needs require specialized esports software.
Real-World Use Cases
Rohan, a tournament operations manager, updates the Data sheet after each weekend tournament and refreshes the Events page to check completion percentage, match type cost, and team ratings before his Monday review call.
Maya, a sponsorship lead, uses the Sponsors and Revenue Mix pages to compare sponsor tier profitability, platform revenue, and regional performance before preparing renewal packages.
Alex, a streaming analyst, reviews viewership by platform, game title, and region to decide where the next content push should happen.
Advantages of Gaming Esports Dashboard in Excel
The biggest advantage is speed. You do not need to design charts, build pivot tables, or structure a dashboard from scratch. The workbook already contains the main analytical pages, cards, charts, slicers, data sheet, and support pivots.
The second advantage is control. Because this is an Excel workbook, you can adapt fields, adjust formatting, add rows, and keep the file offline if needed. The third advantage is cost predictability: one purchase gives you the template without a recurring subscription.
Opportunities for Improvement
This dashboard depends on clean source data. If your esports data is spread across streaming tools, ticketing systems, sponsor spreadsheets, and tournament software, you should standardize the data before using the workbook. The dashboard also does not automatically connect to Twitch, YouTube, Discord, or tournament APIs; you must paste or import prepared data into the Data sheet.
Best Practices
Keep the Data sheet structure stable, enter dates consistently, use the same names for game titles and platforms, and refresh all pivots after every update. Review the Overview page first, then move to Revenue Mix, Audience, Events, and Sponsors for deeper analysis. Keep the Support sheet hidden if end users do not need to edit pivot tables.
Explore Relevant Templates
You may also like Esports Streaming Dashboard in Power BI, E-sports KPI Scorecard in Excel, Sports Team Dashboard in Excel, and Gaming Esports Dashboard in Excel.
Frequently Asked Questions
What does the Gaming Esports Dashboard in Excel track?
It tracks revenue, cost, net profit, profit margin, viewership, streaming hours, events, regions, platforms, tournaments, game titles, sponsor tiers, player segments, match types, team ratings, and event status.
Can I replace the sample data?
Yes. Replace the sample rows in the Data sheet using the same format, then refresh all pivots and charts.
Does the workbook include slicers?
Yes. Slicers are included so you can filter dashboard pages quickly.
Is this a Power BI dashboard?
No. This product is built in Microsoft Excel. A Power BI esports option is available separately in the related templates section.
Can I hide the Support sheet?
Yes. The Support sheet contains pivot tables and can be hidden after setup.
Who should buy this template?
Esports teams, tournament organizers, gaming agencies, streamers, analysts, and sponsors who want an Excel-based reporting dashboard should consider it.
About the Author
Built by PK – Microsoft Certified Professional with 15+ years of Excel, Google Sheets, and Power BI experience. Founder of NextGenTemplates, reaching 300K+ subscribers across YouTube channels. Every template is hand-built and tested before release.
Conclusion
The Gaming Esports Dashboard in Excel gives esports teams and gaming businesses a clean way to monitor revenue, cost, profit, viewership, streaming hours, events, platforms, tournaments, regions, and sponsors. Instead of building reports manually, you can update the Data sheet, refresh the workbook, and review insights across five dashboard pages.
Click here to purchase Gaming Esports Dashboard in Excel
Visit our YouTube channel to learn step-by-step Excel tutorials.