New: NextGenTemplates Academy - video courses on Excel formulas with AI and Pivot Tables & dashboards. Early-bird: 20% off with code EARLYBIRD20 - first 20 orders only. See the courses →
  • Learn Excel (Free Course)
    • 1. Shortcut Keys
    • 2. Fill & Flash Fill
    • 3. Find & Replace
    • 4. Sort & Filter
    • 5. Formulas & Functions
    • 6. Data Validation
    • 7. Conditional Formatting
    • 8. Basic Charts
    • 9. Advanced Charts
    • 10. Pivot Tables
    • 11. Excel Dashboards
    • 12. VBA Course
    • 13. Excel Formulas with AI
  • Templates
  • Tutorials
    • Charts and Visualization
    • VBA
    • Excel Tips and Tricks
    • Excel Dashboards
    • Power Pivot & DAX
  • Power BI
  • Template Store
    • Ready to Use Templates
  • Courses
  • Academy
    • Excel + AI Mastery: 100 Formulas
    • Excel Pivot Tables & Dashboards
  • About Us
  • Contact Us

PK: An Excel Expert

Transforming Data into Decisions
Tag: MTD YTD dashboard

Dashboard Templates

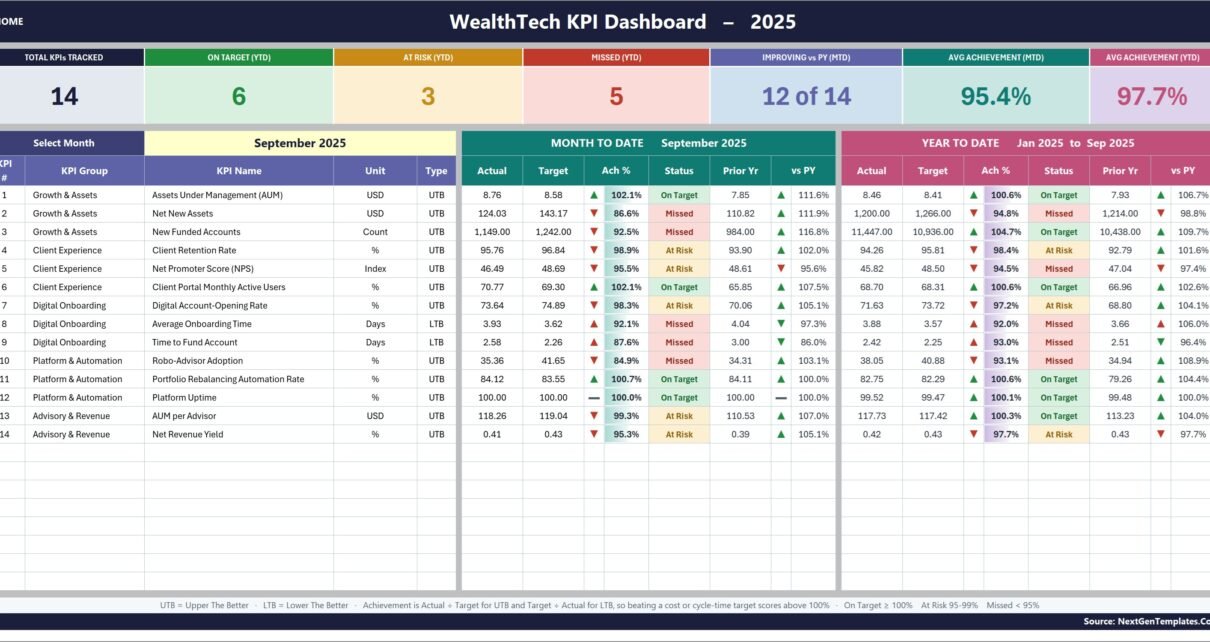
WealthTech KPI Dashboard in Excel

August 21, 2026August 21, 2026 PK0
The WealthTech KPI Dashboard in Excel organizes 14 sample indicators across 5 management groups and 12 months. In one workbook, teams can compare MTD and YTD actuals with targets and
Read More
Dashboard

Sovereign Wealth Funds KPI Dashboard in Excel

May 16, 2026May 16, 2026 PKComments Off on Sovereign Wealth Funds KPI Dashboard in Excel
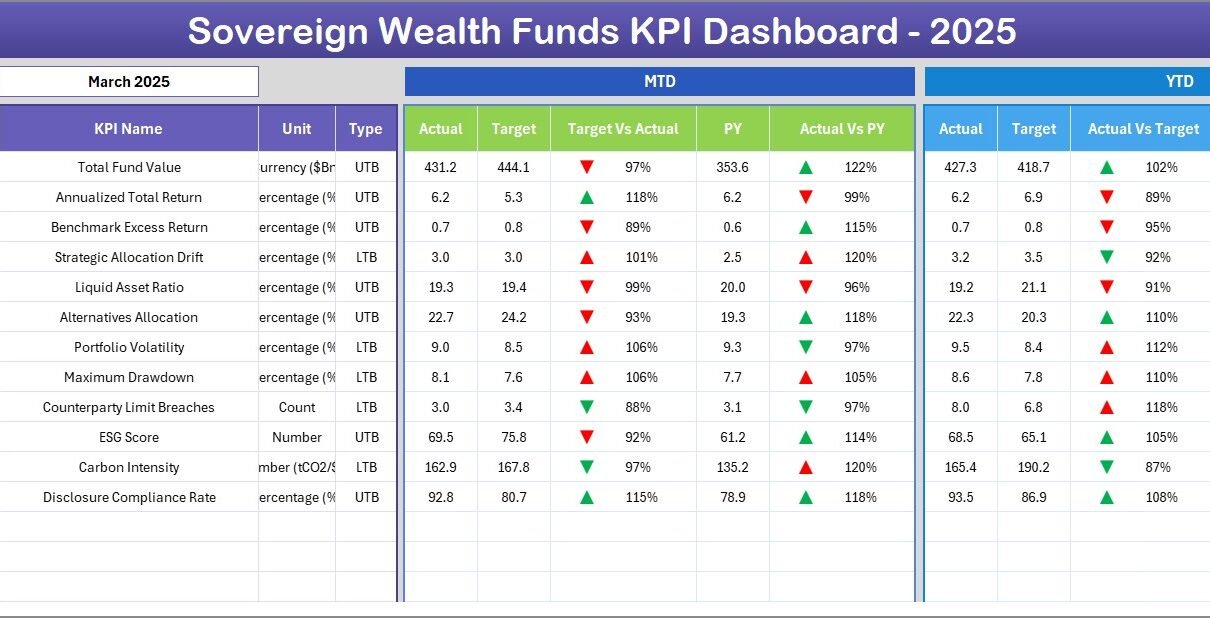
Sovereign Wealth Funds (SWFs) managed over $11.5 trillion in assets globally in 2025, with the top 100 funds growing AUM by 8.4% year-over-year according to the Global SWF 2025 report.
Read More
Dashboard

Nuclear Energy Operations KPI Dashboard in Excel

March 3, 2026October 10, 2026 PKComments Off on Nuclear Energy Operations KPI Dashboard in Excel
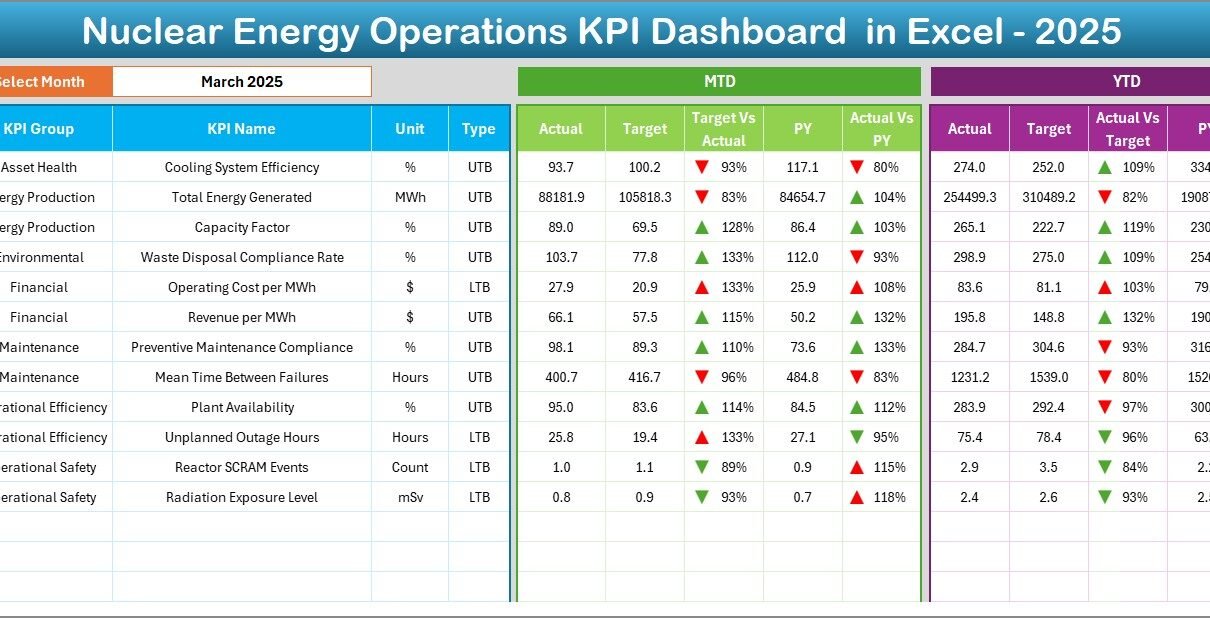
Managing nuclear energy operations demands accuracy, safety, and continuous performance monitoring. However, many power plants still rely on scattered spreadsheets and manual tracking. As a result, decision-makers struggle to monitor
Read More
Dashboard Power BI

Recycling Companies KPI Dashboard in Power BI

February 21, 2026February 21, 2026 PKComments Off on Recycling Companies KPI Dashboard in Power BI
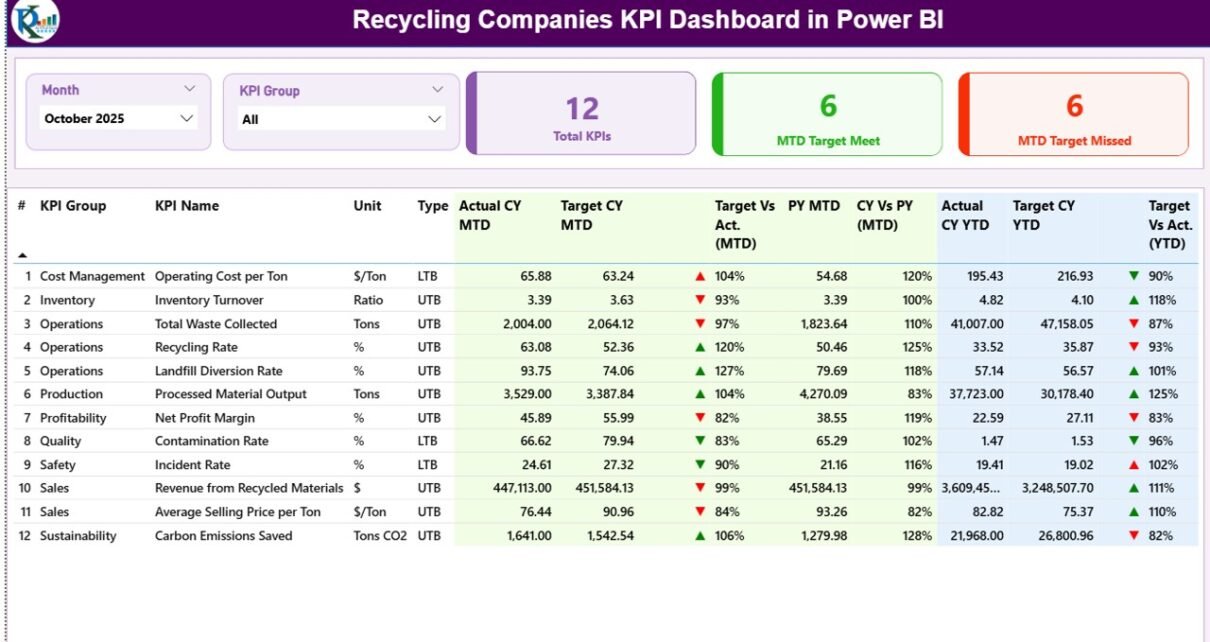
In today’s sustainability-driven world, recycling companies must track performance with accuracy and speed. However, many recycling plants still rely on scattered spreadsheets and manual reports. As a result, managers often
Read More
Dashboard

Recycling Companies KPI Dashboard in Excel

February 21, 2026February 21, 2026 PKComments Off on Recycling Companies KPI Dashboard in Excel
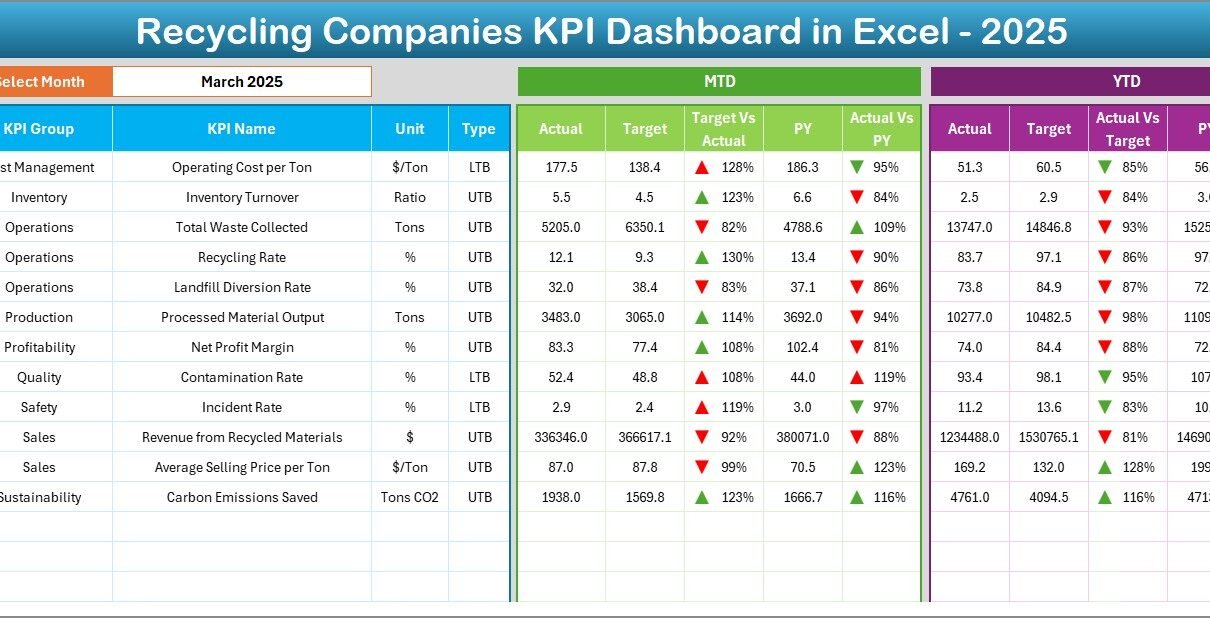
In today’s sustainability-driven world, recycling companies play a critical role in protecting the environment and supporting the circular economy. However, many recycling businesses still depend on scattered spreadsheets and manual
Read More
Dashboard

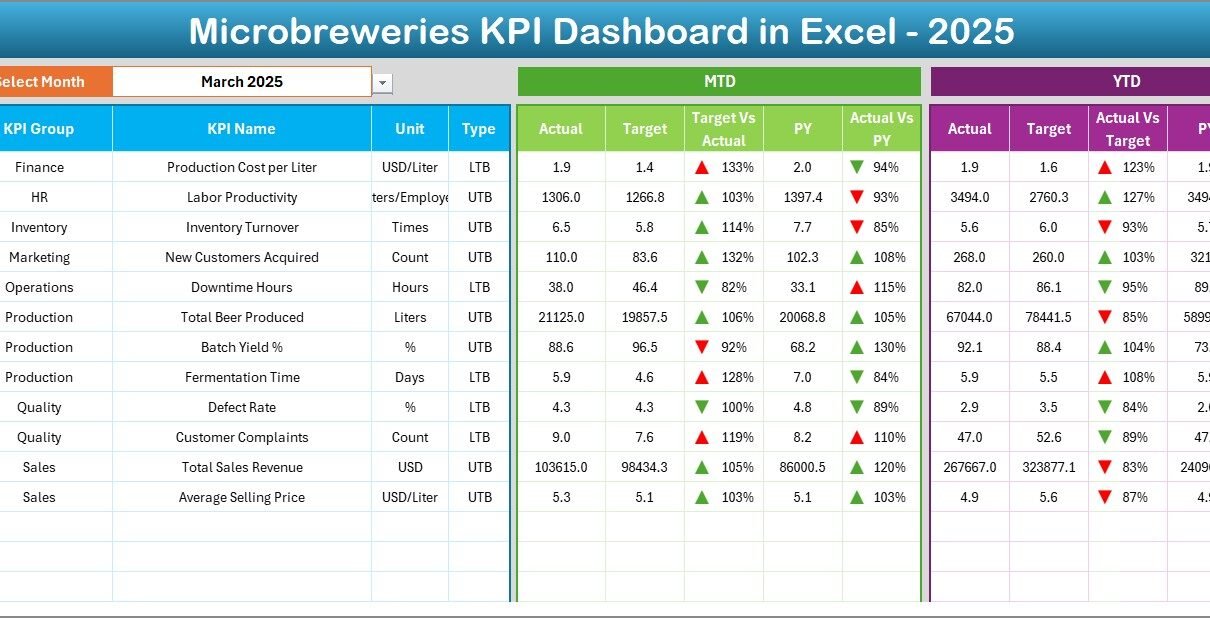
Microbreweries KPI Dashboard in Excel

February 19, 2026February 19, 2026 PKComments Off on Microbreweries KPI Dashboard in Excel
Running a microbrewery feels exciting. However, excitement alone does not build profit. You must track production, sales, quality, wastage, and margins every single month. Otherwise, small leaks in cost or
Read More
Dashboard Power BI

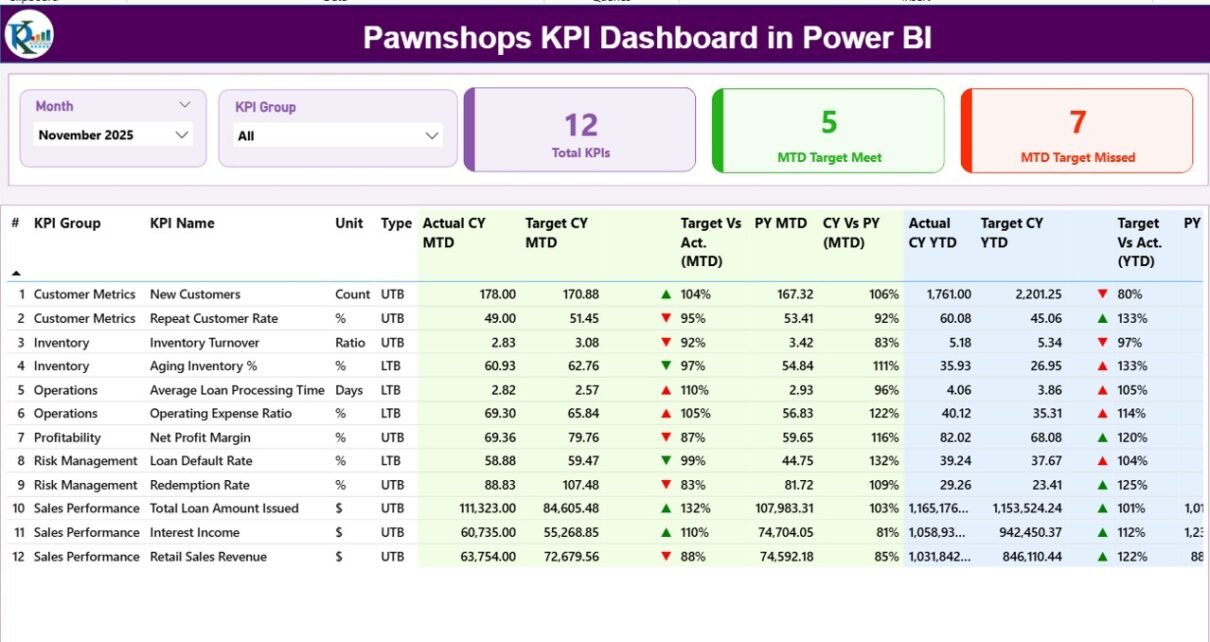
Pawnshops KPI Dashboard in Power BI

February 18, 2026February 18, 2026 PKComments Off on Pawnshops KPI Dashboard in Power BI
In today’s competitive retail and financial service market, pawnshops must track performance carefully. Many pawnshop owners manage daily transactions, gold loans, resale items, and customer relationships. However, without a structured
Read More
Dashboard

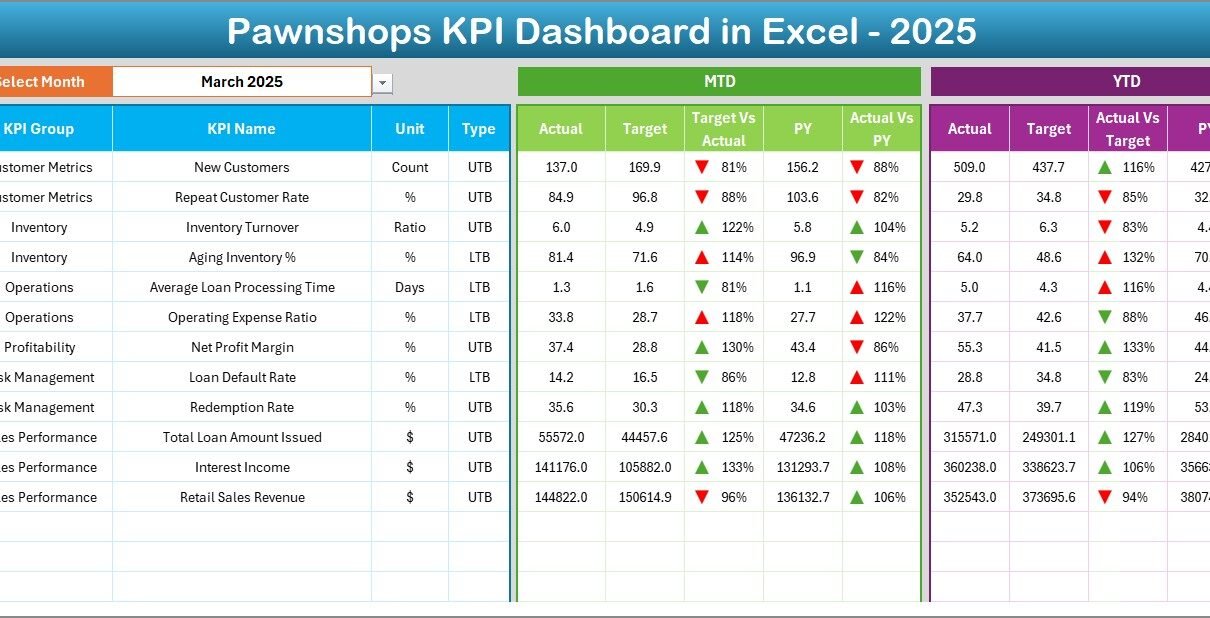
Pawnshops KPI Dashboard in Excel

February 18, 2026February 18, 2026 PKComments Off on Pawnshops KPI Dashboard in Excel
Running a pawnshop requires sharp decision-making. You manage loans, inventory, customer transactions, redemptions, defaults, and profit margins every single day. However, if you rely on scattered spreadsheets or manual calculations,
Read More
Templates

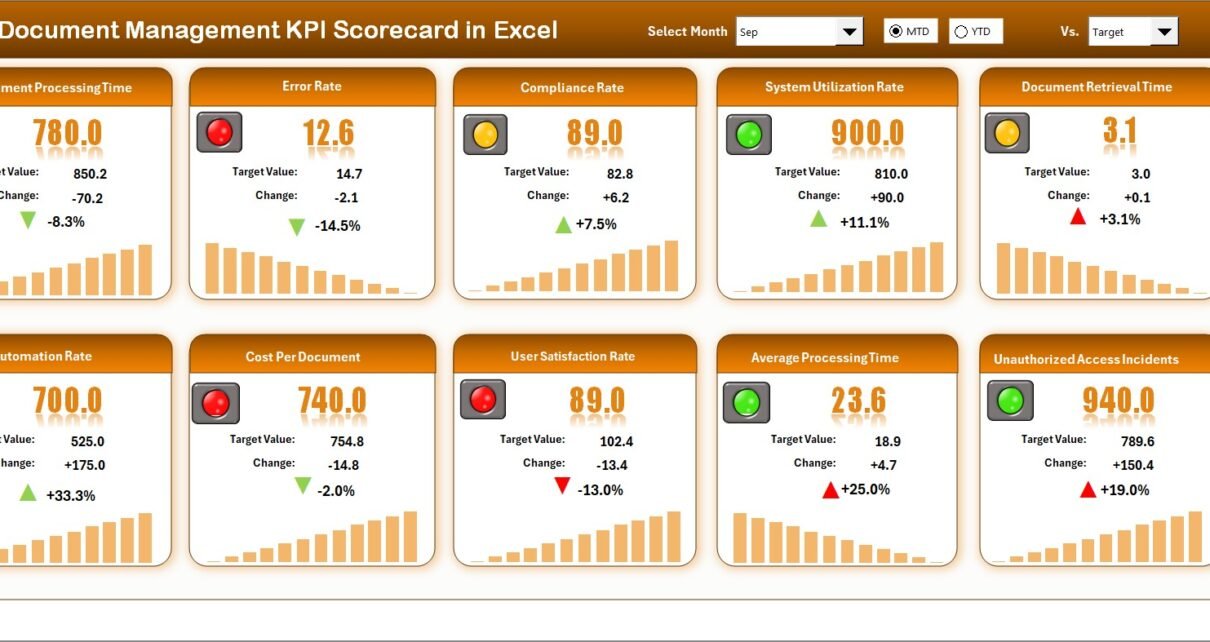
Document Management KPI Scorecard In Excel

February 17, 2026February 17, 2026 PKComments Off on Document Management KPI Scorecard In Excel
Managing documents sounds simple. However, in reality, it becomes complex very quickly. Teams create files daily. Departments share reports. Compliance rules demand accuracy. Meanwhile, managers expect fast access and zero
Read More
Dashboard Power BI

Web Development Agencies KPI Dashboard in Power BI

February 17, 2026February 17, 2026 PKComments Off on Web Development Agencies KPI Dashboard in Power BI
Web development agencies operate in a fast-moving and highly competitive market. Clients expect fast delivery, clean code, strong UX, and measurable results. However, many agencies still depend on scattered spreadsheets
Read More

Posts pagination

1 2 … 8 Next
  • Learn Excel (Free Course)
    • 1. Shortcut Keys
    • 2. Fill & Flash Fill
    • 3. Find & Replace
    • 4. Sort & Filter
    • 5. Formulas & Functions
    • 6. Data Validation
    • 7. Conditional Formatting
    • 8. Basic Charts
    • 9. Advanced Charts
    • 10. Pivot Tables
    • 11. Excel Dashboards
    • 12. VBA Course
    • 13. Excel Formulas with AI
  • Templates
  • Tutorials
    • Charts and Visualization
    • VBA
    • Excel Tips and Tricks
    • Excel Dashboards
    • Power Pivot & DAX
  • Power BI
  • Template Store
    • Ready to Use Templates
  • Courses
  • Academy
    • Excel + AI Mastery: 100 Formulas
    • Excel Pivot Tables & Dashboards
  • About Us
  • Contact Us
Copyright © 2023 PK-AnExcelExpert.com - Privacy Policy