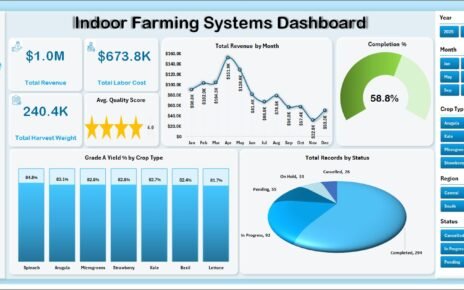
Sovereign Wealth Funds (SWFs) managed over $11.5 trillion in assets globally in 2025, with the top 100 funds growing AUM by 8.4% year-over-year according to the Global SWF 2025 report. Yet most fund analysts still report performance through static PowerPoint decks rebuilt from scratch every month. The Sovereign Wealth Funds KPI Dashboard in Excel replaces that workflow with a single 7-sheet workbook that tracks every fund KPI — Return %, Sharpe Ratio, Tracking Error, Expense Ratio, ESG Score, Liquidity Coverage, and any custom metric — with built-in MTD / YTD calculations, Target vs Actual variance arrows, and Previous Year comparison. In this post I’ll walk you through every page of the template, show you how the dynamic month dropdown works, and explain when this beats $200,000-a-year platforms like Addepar, Allvue, or eFront.Sovereign Wealth Funds KPI Dashboard in Excel
Last updated: May 2026. Built and tested by PK (Microsoft Certified Professional, 300K+ YouTube subscribers).Sovereign Wealth Funds KPI Dashboard in Excel
📥 Download the Sovereign Wealth Funds KPI Dashboard in Excel — $14.99 one-time, lifetime access
Key Features of the Sovereign Wealth Funds KPI Dashboard
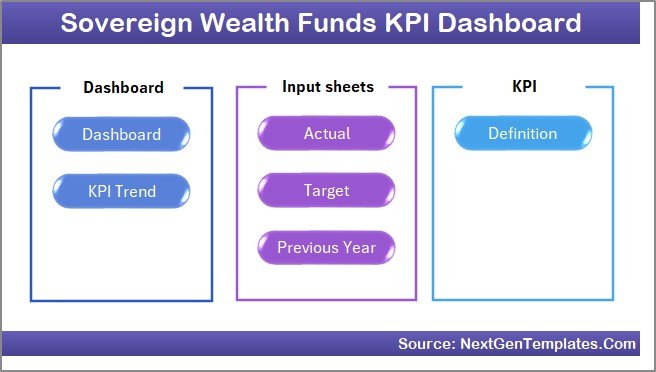
📊 7 connected worksheets — one Home navigation page, an interactive Dashboard, a KPI Trend drill-down, three input sheets (Actual, Target, Previous Year), and a master KPI Definition sheet. Every page is formula-linked, so a change in an input sheet refreshes the dashboard in real time.
📅 Dynamic month selector — pick any month from cell D3 of the Dashboard tab and every MTD figure, YTD calculation, variance %, and trend chart updates instantly. No macros required, so the file opens cleanly in Excel for the web and Excel Mobile too.
🎯 Triple-comparison layout — every KPI is benchmarked against three references at once: the monthly Target, the Previous Year actual, and the current Actual. Green-up and red-down arrows are driven by Excel conditional formatting and flip automatically based on whether the KPI is LTB (Lower the Better) or UTB (Upper the Better).
🔁 Auto-rolling fiscal year — type the first month of your fiscal year on cell E1 of the Actual Input sheet (January, April, July, October — any month). All input columns and dashboard headers re-anchor to that calendar, so the same file works for Middle Eastern, Asian, European, and North American SWFs without rebuilding.
📈 KPI Trend isolation — pick any single KPI from the dropdown on cell C3 of the KPI Trend sheet and the page rebuilds itself with that KPI’s group, unit, type, formula, definition, plus dual MTD and YTD trend charts comparing Actual, Target, and Previous Year.
🧠 LTB / UTB intelligence — the master KPI Definition sheet has a column where each KPI is tagged as Lower-the-Better or Upper-the-Better. The dashboard’s variance arrows flip direction automatically: a lower number on Tracking Error shows green; a lower number on Sharpe Ratio shows red.
Dashboard Pages — Walkthrough of All 7 Sheets
Page 1: Home Sheet
The Home sheet is the navigation hub. Six large buttons jump straight to each worksheet — Dashboard, KPI Trend, Actual Numbers Input, Target Numbers Input, Previous Year Numbers, and KPI Definition. The single-click navigation keeps the workbook accessible for senior fund managers who don’t want to hunt through sheet tabs.
 Home Page
📥 Buy the Sovereign Wealth Funds KPI Dashboard in Excel — $14.99 one-time
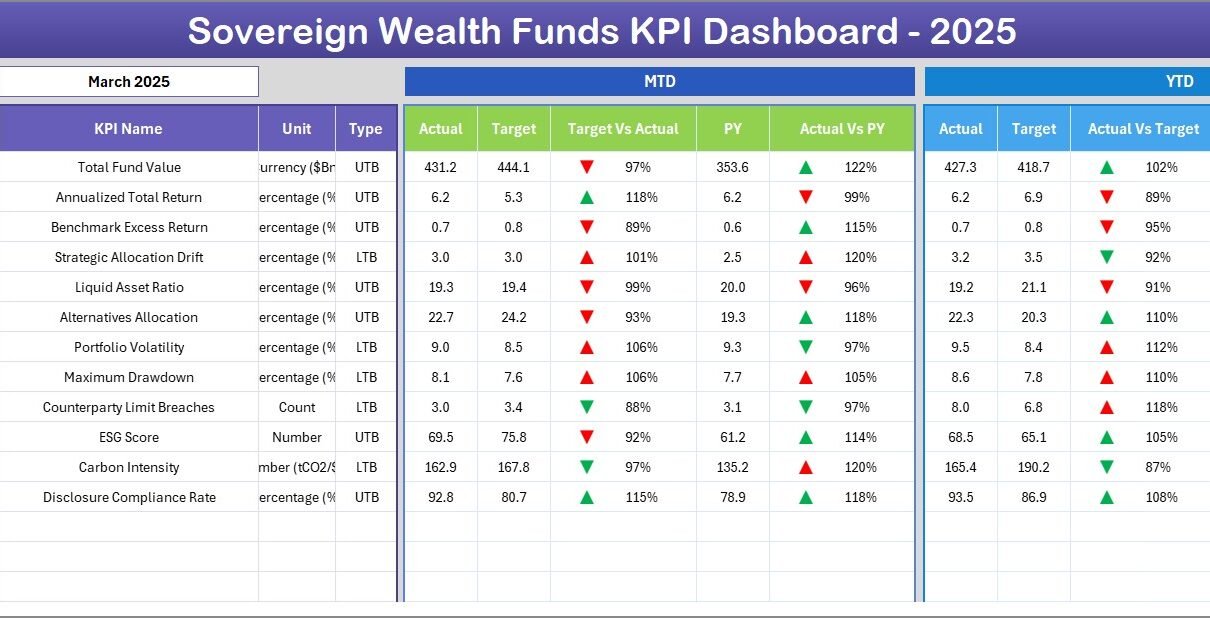
Page 2: Dashboard Sheet
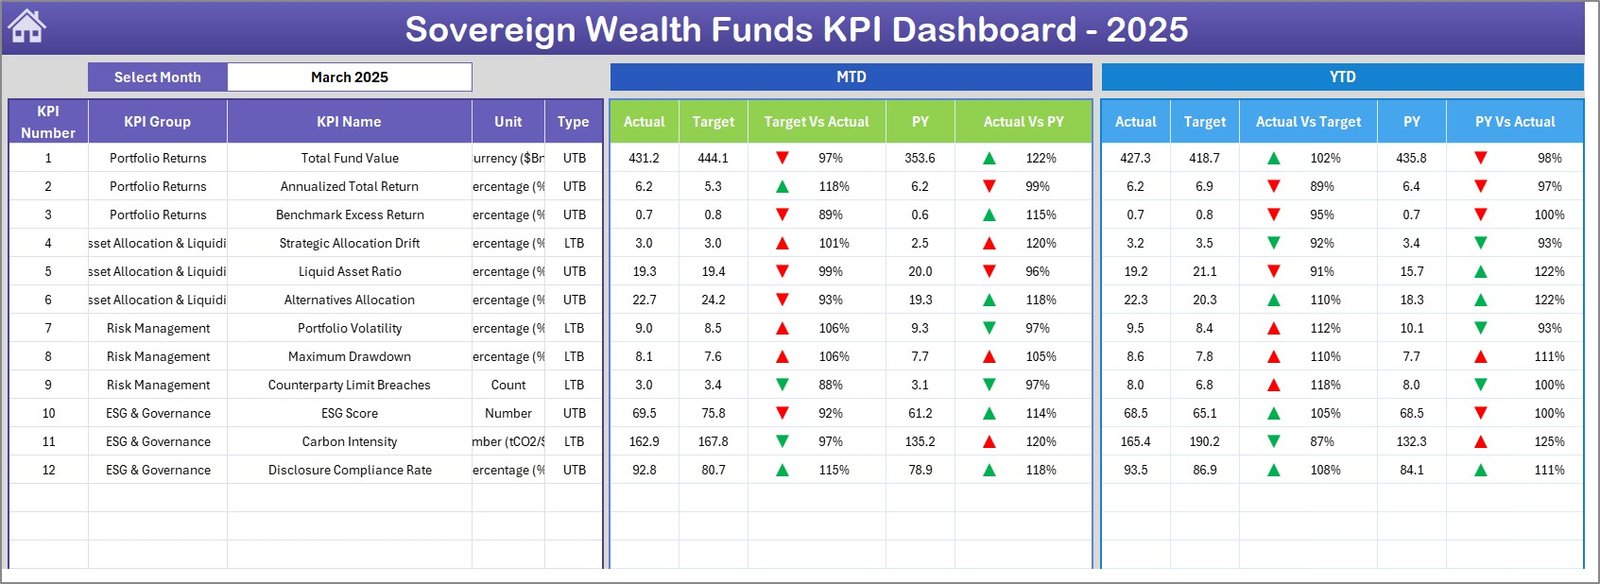
The main dashboard. Select your month from the dropdown on D3 and every metric below recalculates. The left block shows MTD — Actual, Target, Previous Year, Target vs Actual variance %, and PY vs Actual variance %, each with conditional-formatting up/down arrows. The right block mirrors the same six columns for YTD. You get monthly tactical performance and cumulative annual performance in one screen, which is exactly how SWF investment committees expect to see fund KPIs.
 Sovereign Wealth Funds KPI Dashboard
Page 3: KPI Trend Sheet
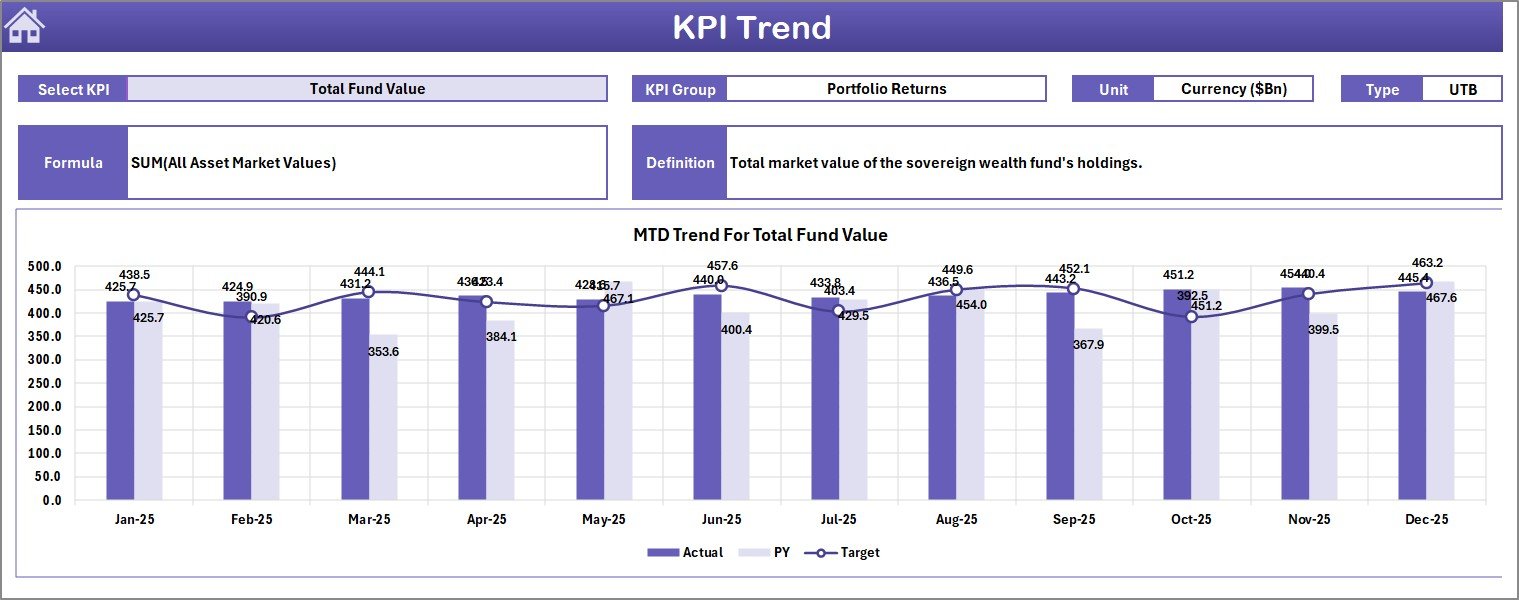
Pick a KPI from the dropdown on cell C3 — say Annual Return % or Tracking Error bps. The top section displays the KPI’s Group, Unit, Type (LTB or UTB), Formula, and Definition, pulled live from the KPI Definition sheet. Below, two charts plot Actual vs Target vs Previous Year on both an MTD and a YTD basis across all 12 months. This is the page you screenshot into board decks.
 KPI Trend Sheet
📥 Buy the Sovereign Wealth Funds KPI Dashboard in Excel — $14.99 one-time
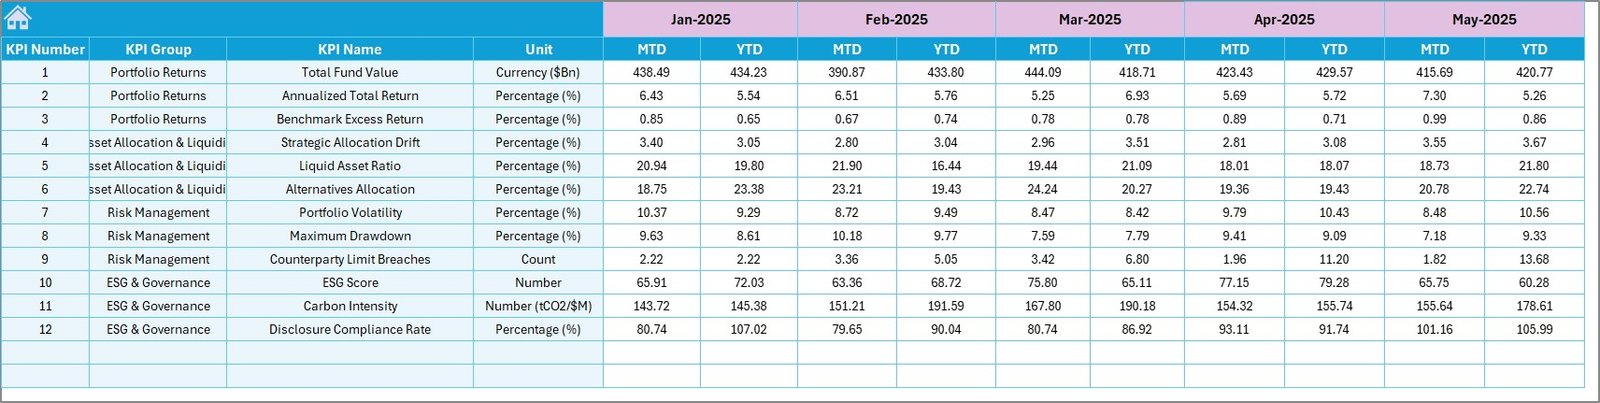
Page 4: Actual Numbers Input Sheet
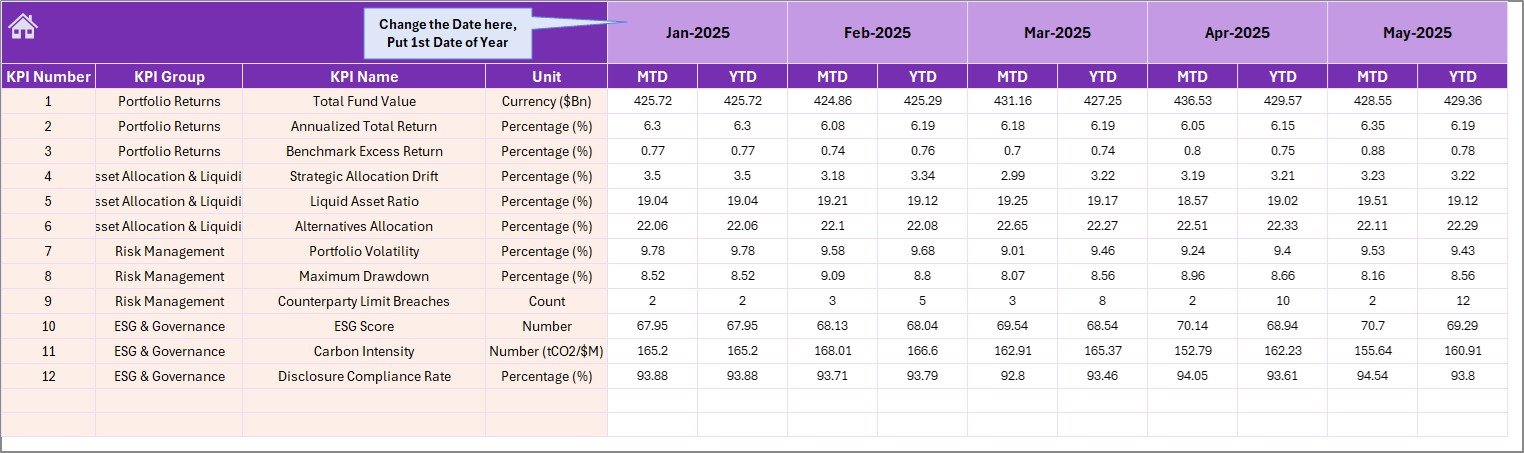
Enter your monthly actuals for every KPI here. The fiscal year anchor lives on cell E1 — typing “Apr” or “Jul” re-labels every column header automatically. The dashboard reads directly from this sheet, so this is the only page you need to update each month-end.
 Actual Numbers Input sheet
Page 5: Target Numbers Input Sheet
Capture the monthly MTD and YTD targets for every KPI. These targets are typically set during the annual budget cycle. The dashboard’s Target vs Actual variance columns and the target line on each KPI Trend chart all pull from this sheet.
 Target Number Input sheet
📥 Buy the Sovereign Wealth Funds KPI Dashboard in Excel — $14.99 one-time
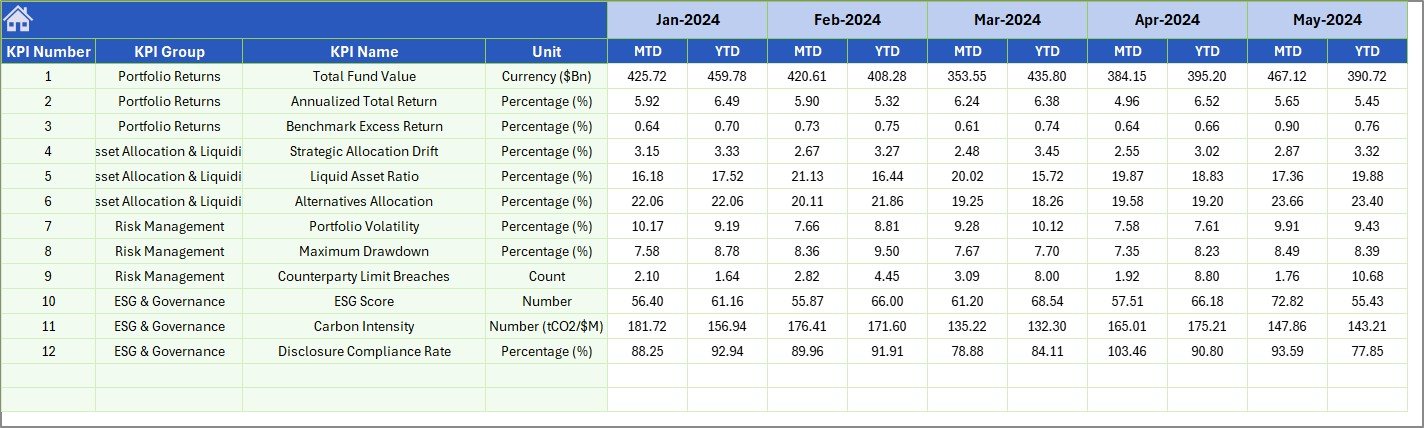
Page 6: Previous Year Number Sheet
Same column layout as the Actual sheet, but populated with the prior fiscal year’s MTD and YTD numbers. These figures drive the PY vs Actual variance % column on the Dashboard and the Previous Year line on every KPI Trend chart. Update this once a year after audited financials are signed off.
 Previous Year Number Input sheet
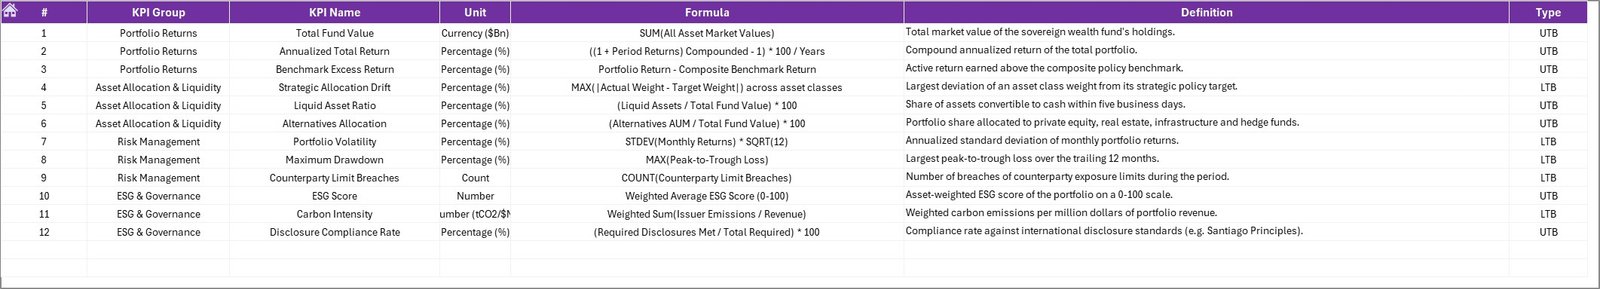
Page 7: KPI Definition Sheet
The configuration master. Enter the KPI Name, KPI Group (Return / Risk / Liquidity / ESG / Operational), Unit (%, USD, ratio, bps), Formula, KPI Definition, and KPI Type (LTB or UTB). Every other sheet looks up information from here using formulas, so renaming, re-grouping, or reordering KPIs only requires editing this one page.
 KPI Definition sheet
Excel Template vs Google Sheets DIY vs Paid SWF Analytics Software
| Feature | Sovereign Wealth Funds KPI Dashboard (Excel) | DIY Google Sheets | Paid SaaS (Addepar / Allvue / eFront) |
|---|---|---|---|
| Cost | $14.99 one-time | $0 (build it yourself) | $30,000 – $200,000+ / year |
| Setup time | Under 10 minutes | 20–40 hours | 3–6 months |
| MTD / YTD pre-built | ✅ | ❌ | ✅ |
| Target vs Actual variance arrows | ✅ | ❌ | ✅ |
| LTB / UTB logic per KPI | ✅ | ❌ | ✅ |
| Works offline | ✅ | ❌ | ❌ |
| Customisable KPI list | ✅ Unlimited | ✅ Unlimited | Limited to vendor schema |
| Editable formulas | ✅ Fully open | ✅ Fully open | ❌ Locked vendor logic |
| Lifetime access | ✅ | ✅ | ❌ (subscription cancels access) |
Who Should Use This Dashboard
📥 Buy the Sovereign Wealth Funds KPI Dashboard in Excel — $14.99 one-time
✅ Best fit for:
- SWF investment offices and treasury teams reporting performance to boards
- Family offices managing multi-asset portfolios who want full formula control
- Pension fund analysts producing monthly performance packs
- Endowments and foundations tracking 10–50 KPIs across asset classes
- Independent fund consultants delivering standardised reporting to multiple clients
- Anyone replacing static PowerPoint reports with a one-input-sheet workflow
❌ Not the right fit if you need:
- Real-time data feeds from Bloomberg, FactSet, or custodian APIs (this is a manual-input template)
- Multi-user concurrent editing with audit trails (use SaaS for that)
- Regulatory filing automation or attribution analysis
Real-World Use Cases
Aisha — Performance Analyst, Gulf-region SWF. Aisha replaced a 38-page monthly PowerPoint pack with this 7-sheet workbook. Month-end reporting time dropped from 2.5 days to 3 hours; she now spends the saved time on attribution commentary.
Marco — Single-Family Office Director, Switzerland. Marco tracks 14 KPIs across direct equity, private credit, real estate, and crypto for the principal family. The LTB / UTB toggle handles return KPIs and risk KPIs in the same template — no separate spreadsheets needed.
Priya — Independent Pension Consultant, India. Priya delivers the same Excel pack to four pension client funds. Each instance has its own fiscal year start (different funds use different calendars); the E1 anchor handles this without code changes.
Advantages of This Template
📥 Buy the Sovereign Wealth Funds KPI Dashboard in Excel — $14.99 one-time
- One-time payment, lifetime access — no recurring SaaS fees, no per-user seats.
- Macro-free — opens cleanly in Excel desktop, Excel for the web, and Excel Mobile. No security warnings.
- Fully customisable — every formula is visible and editable. Add KPIs, change fiscal year, restyle charts.
- Offline-capable — works without internet, ideal for travel, secure environments, and air-gapped review meetings.
- Single source of truth — all KPI metadata lives on one sheet; rest of the workbook reads via formulas.
Opportunities for Improvement
The template is intentionally manual-entry. If you have a Bloomberg, FactSet, or custodian feed, you can connect it via Power Query and point the Actual Input sheet at the query output — converting this into a semi-automated dashboard in about an hour. You can also publish it to SharePoint or OneDrive Business for shared read-only access by board members.
Best Practices for Using the Dashboard
- Lock the input sheets after each month-end close using Excel’s sheet protection so audited numbers can’t be edited inadvertently.
- Keep the KPI Definition sheet as the master — never hard-code KPI names anywhere else; let them flow from the Definition sheet.
- Save a dated snapshot every month (e.g., SWF_KPI_Dashboard_2026-05.xlsx) for audit trail.
- Set LTB / UTB carefully — Tracking Error, Expense Ratio, Drawdown are LTB; Annual Return, Sharpe Ratio, Information Ratio are UTB.
- Limit the dashboard to 15–25 KPIs for board-pack readability. Use the KPI Trend sheet for deep dives on any single metric.
Explore Other Relevant Excel Templates
- Wealth Tech Dashboard in Excel — broader wealth-management KPI tracking
- Sovereign Wealth Funds Dashboard in Power BI — Power BI version for live data refresh
- Mobile Banking Dashboard in Power BI — adjacent fintech analytics
- Call Abandonment Rate KPI Dashboard in Power BI — same MTD / YTD KPI framework, different domain
Frequently Asked Questions
📥 Buy the Sovereign Wealth Funds KPI Dashboard in Excel — $14.99 one-time
What is a Sovereign Wealth Funds KPI Dashboard in Excel?
It is a pre-built 7-sheet Excel workbook that tracks fund performance KPIs with MTD and YTD calculations, Target vs Actual variance arrows, and Previous Year comparison. Users enter monthly actuals, targets, and previous year numbers into input sheets, and the dashboard updates automatically when they pick a month from the dropdown.
Can I add or remove KPIs from this dashboard?
Yes. The KPI Definition sheet is the single source of truth. Add a new row with the KPI Name, Group, Unit, Formula, Definition, and Type (LTB or UTB), and the rest of the dashboard picks it up automatically through formulas. The template supports an unlimited number of KPIs.
Does the dashboard use any macros or VBA?
No. The template is 100% formula-driven with no macros, no VBA, and no add-ins required. This means it opens cleanly in Excel desktop, Excel for the web, and Excel Mobile, without triggering any macro security warnings.
What fiscal year calendars are supported?
Any. The first month of the fiscal year is set on cell E1 of the Actual Numbers Input sheet. Type “Jan” for calendar year, “Apr” for India / UK fiscal year, “Jul” for many Australian funds, or any other month. All column headers and dashboard labels re-anchor automatically.
What is the difference between LTB and UTB KPIs?
LTB means “Lower the Better” — examples are Tracking Error, Expense Ratio, and Drawdown, where a smaller number is good. UTB means “Upper the Better” — examples are Annual Return, Sharpe Ratio, and ESG Score, where a larger number is good. The conditional formatting arrows on the dashboard flip direction based on this tag.
Can multiple people edit the file at the same time?
The file supports co-authoring when saved on OneDrive Business or SharePoint, but for audit trail purposes most fund teams have one analyst own the inputs and others access a read-only copy. For full concurrent multi-user editing with audit trails, a SaaS platform like Addepar is more appropriate.
What is the price and is there a refund policy?
The template costs $14.99 as a one-time payment with lifetime access and free future updates. NextGenTemplates offers a refund policy on digital downloads — see the product page for current terms.
About the Author
This template and post are by PK, a Microsoft Certified Professional with 14+ years of Excel and Power BI dashboard development experience. PK runs the @PK-AnExcelExpert YouTube channel (300K+ subscribers across the network) and has built dashboards for clients in financial services, manufacturing, and consulting across 40+ countries through NextGenTemplates.
Get the Template
📥 Buy the Sovereign Wealth Funds KPI Dashboard in Excel — $14.99 one-time
🎥 Watch the video tutorial on the PK – An Excel Expert YouTube channel for a guided walkthrough of every sheet, including how to add a new KPI, change the fiscal year, and customise the variance arrows.
Visit the NextGenTemplates store — nextgentemplates.com — for 5,600+ Excel, Google Sheets, Power BI, and HTML templates trusted by 8,400+ teams in 40+ countries.