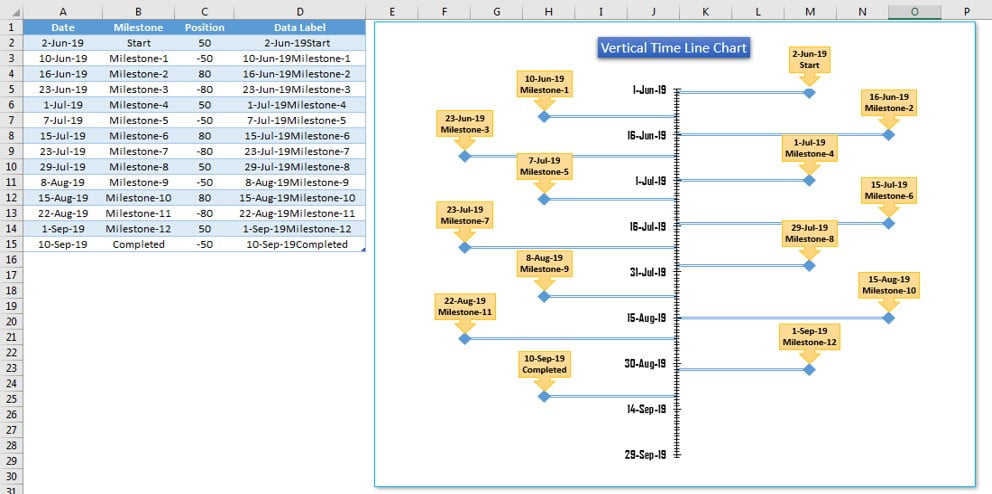
A timeline chart is an effective way to visualize the different Milestones of a Project. Here we have created a Vertical Timeline Chart using Scatter Chart in Excel. This is a dynamic Chart if you will add a new milestone in table, it will be reflected on the chart automatically.
Vertical Timeline Chart using Scatter chart in Excel
Below is the snapshot of the Vertical Timeline chart which we have created using the Scatter Chart in Excel.
Enter the data in the left hand side table as Date, Milestone and Position in positive or negative. Data Label will created automatically. It will show the milestone on the chart according the to Position you have given as input.
Click to buy Vertical Timeline Chart using Scatter chart in Excel
Visit our YouTube channel to learn step-by-step video tutorials
Watch the step by step video tutorial:
Click to buy Vertical Timeline Chart using Scatter chart in Excel