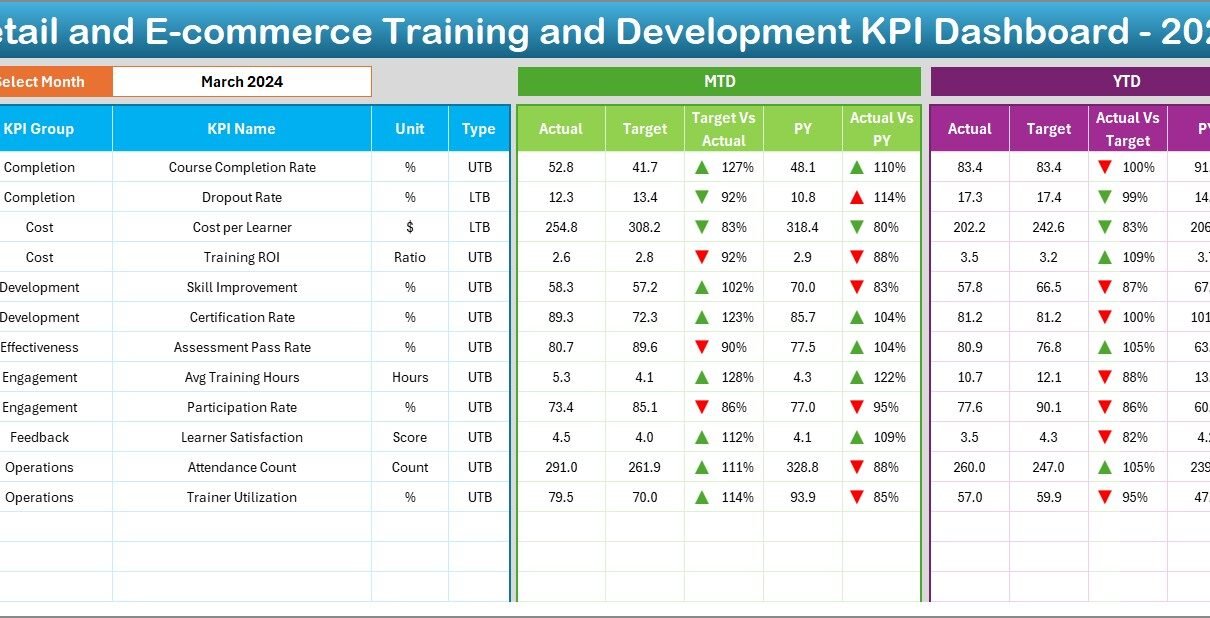
• Advanced Excel
    • Shortcut Keys
    • Useful Formulas
    • Basic Charts
    • Advanced Chart
    • Sort and Filter
    • Pivot Table
    • Data Validation
    • Conditional Formatting
    • Auto Fill and Flash Fill
    • Find and Replace
  • VBA Course
  • Products
    • Restaurant Management
    • PK’s Utility Tool V3.0
    • PK’s Utility Tool V2.0
    • PK’s Utility Tool V1.0
    • Task Management
    • AMS – Lite
    • AMS V1.0
    • AMS V2.0
    • Sale/Purchase Software
    • PK’s Function Kit
  • Blogs
    • Charts and Visualization
    • VBA
    • Excel Tips and Tricks
    • Templates
  • Excel Dashboard
    • Sales Dashboard
    • Process Dashboard
    • Performance Dashboard
    • Project Management
    • Outbound Dashboard
    • Incentive Dashboard
    • Zonal Dashboard in Excel
    • Quick Dashboard
  • Free Templates
  • Power BI
  • About Us
  • Contact Us

PK: An Excel Expert

Transforming Data into Decisions

Tag: Conditional Formatting

Custom Number formatting to highlight Sales
Excel Tips and Tricks

Highlight Sales Figures with Custom Number Formatting in Excel

March 23, 2023March 23, 2023 PKComments Off on Highlight Sales Figures with Custom Number Formatting in Excel
When working with sales data, it can be helpful to quickly identify which sales figures are doing well and which ones need improvement. Custom number formatting in Excel allows you
Read More
Waffle Chart with Football Icon-1
Charts and Visualization

Waffle chart with Football Icon in Excel

March 9, 2023March 9, 2023 PKComments Off on Waffle chart with Football Icon in Excel
Data visualization is important part of data analysis. It enables us to better understand the data, identify trends, and make informed decisions. There are several types of charts and graphs
Read More
Highlight selected Row and Column in Data
Excel Tips and Tricks

Highlight Row and Column of Active Cell in Data Automatically

March 2, 2023March 11, 2023 PKComments Off on Highlight Row and Column of Active Cell in Data Automatically
Data analysis is an essential part of any business. Microsoft Excel is a great tool for organizing, analyzing, and visualizing data. It can be challenging to read through large tables
Read More
Dynamically highlight topper student on the chart
Charts and Visualization

Dynamically highlight topper student chart

February 26, 2023March 11, 2023 PKComments Off on Dynamically highlight topper student chart
I. Introduction a. Explanation of what a dynamically highlight topper student chart is: A dynamically highlight topper student chart is a type of chart that highlights the student with the
Read More
Dynamic Attendance Sheet Using Power Pivot
Templates

Dynamic Attendance Sheet Using Power Pivot

February 20, 2023February 20, 2023 PKComments Off on Dynamic Attendance Sheet Using Power Pivot
Introduction In today's digital age, managing attendance in schools, colleges, or offices is a time-consuming task. This dynamic attendance sheet can help streamline this process by providing real-time attendance data
Read More
Paste Special in Microsoft Excel
Excel Tips and Tricks

Paste Special in Microsoft Excel

November 22, 2022March 21, 2023 PKComments Off on Paste Special in Microsoft Excel
Introduction to Paste Special in Microsoft Excel Microsoft Excel offers a powerful feature called Paste Special, which enables users to paste data in various formats and apply a range of
Read More
Quick Analysis Tool
Charts and Visualization Excel Tips and Tricks

Quick Analysis Tool in Microsoft Excel

October 2, 2022October 2, 2022 PKComments Off on Quick Analysis Tool in Microsoft Excel
Quick Analysis Tool is used to apply the quick conditional formatting, Quick Charts, add Totals, Quick Pivot Tables and to add quick Sparklines in selected data.   After selecting the
Read More
Multicolor data bar with REPT function
Charts and Visualization

Multi-color Data bar with REPT function

July 12, 2022July 12, 2022 PKComments Off on Multi-color Data bar with REPT function
In this article, we have created multi-color data bars in Excel cells using REPT function. We have used the conditional formatting to change the color based on certain criteria.  
Read More
Conditional formatting in Excel Chart
Charts and Visualization

Conditional formatting in Excel Chart

May 3, 2022 PKComments Off on Conditional formatting in Excel Chart
In this article, you will learn how to use Conditional formatting in Excel Chart. You can use this trick to show to Target Vs Actual number.   [caption id="attachment_57797" align="alignnone"
Read More
Sales Analysis Heat Map
Charts and Visualization

Sales Analysis Heat Map by Time and Day

March 27, 2022March 27, 2022 PKComments Off on Sales Analysis Heat Map by Time and Day
In this article, we have created a dynamic Sales Analysis Heat Map by Time and Day. Using this analysis, you will get to know your most busy time in a
Read More

Posts navigation

1 2 … 5 Next
  • Advanced Excel
    • Shortcut Keys
    • Useful Formulas
    • Basic Charts
    • Advanced Chart
    • Sort and Filter
    • Pivot Table
    • Data Validation
    • Conditional Formatting
    • Auto Fill and Flash Fill
    • Find and Replace
  • VBA Course
  • Products
    • Restaurant Management
    • PK’s Utility Tool V3.0
    • PK’s Utility Tool V2.0
    • PK’s Utility Tool V1.0
    • Task Management
    • AMS – Lite
    • AMS V1.0
    • AMS V2.0
    • Sale/Purchase Software
    • PK’s Function Kit
  • Blogs
    • Charts and Visualization
    • VBA
    • Excel Tips and Tricks
    • Templates
  • Excel Dashboard
    • Sales Dashboard
    • Process Dashboard
    • Performance Dashboard
    • Project Management
    • Outbound Dashboard
    • Incentive Dashboard
    • Zonal Dashboard in Excel
    • Quick Dashboard
  • Free Templates
  • Power BI
  • About Us
  • Contact Us
Copyright © 2023 PK-AnExcelExpert.com - Privacy Policy