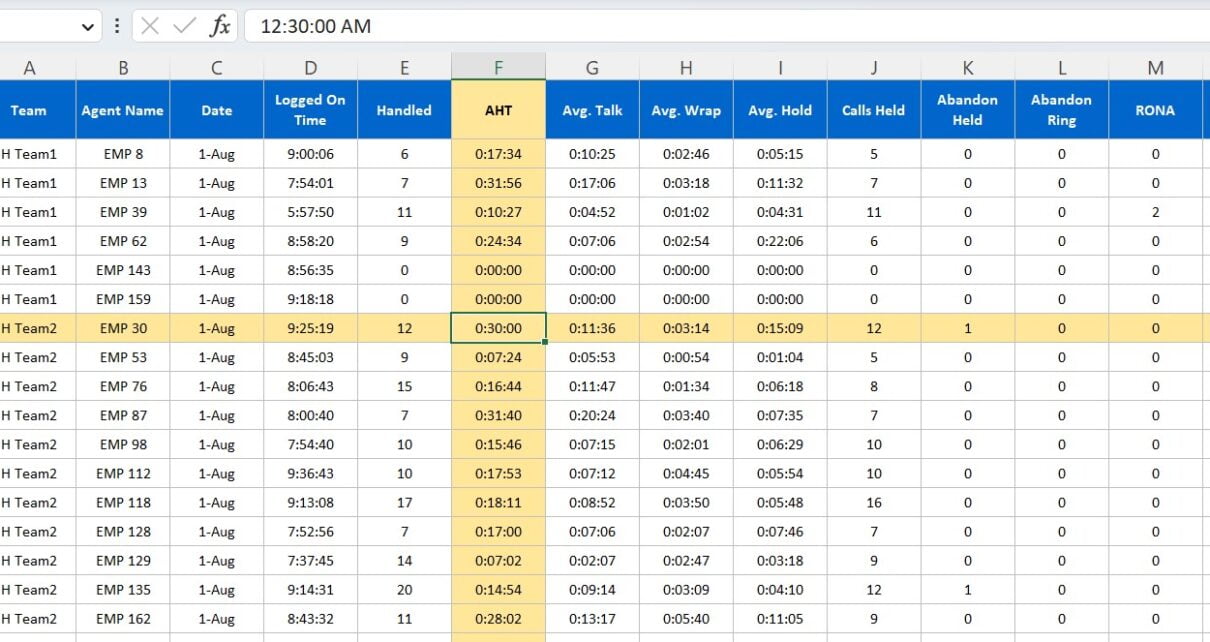
Data analysis is an essential part of any business. Microsoft Excel is a great tool for organizing, analyzing, and visualizing data. It can be challenging to read through large tables of data. Highlight Row and Column of Active Cell in Data Automatically can help you to make it much easier to read and understand data. In this article, you will learn how to highlight the selected row and column of the active cell in data automatically using Conditional formatting and VBA code.
Using Conditional Formatting
Conditional formatting is a powerful feature in Excel which allows you to format cells based on specific criteria. You can use conditional formatting to highlight the selected row and column of the active cell in data automatically.
To use conditional formatting to highlight the row and column of the active cell, you will need to apply the below given formula –
"=OR(ROW()=CELL("row"),COLUMN()=CELL("Col"))"
Below are the steps to apply this formula in conditional formatting-
- Step 1: Select the range of cells that you want to apply the formatting to.
- Step 2: Click on the “Conditional Formatting” button in the “Styles” group of the “Home” tab.
- Step 3: Select “New Rule” from the drop-down menu.
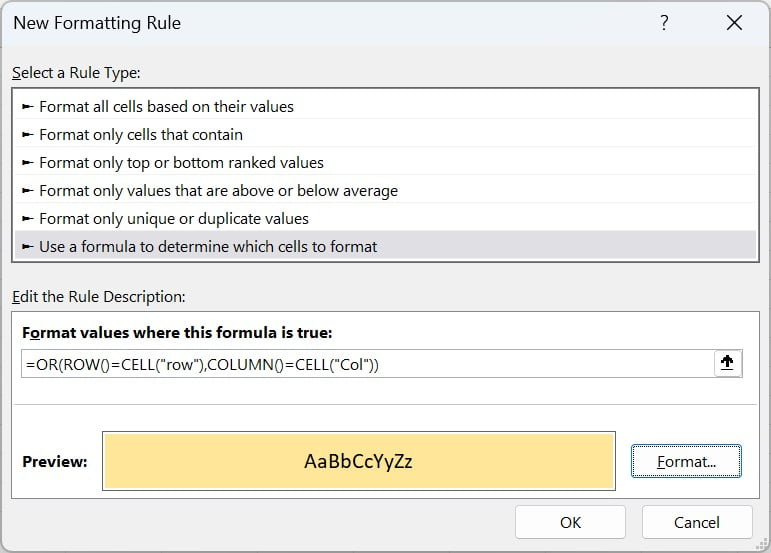
- Step 4: In the “New Formatting Rule” dialog box, select “Use a formula to determine which cells to format.”
- Step 5: Enter the given formula below in the “Format values where this formula is true” field –
"=OR(ROW()=CELL("row"),COLUMN()=CELL("Col"))"
- Step 6: Click on the “Format” button to select the formatting options.
- Step 7: Choose the yellow background color with black font color to make the selected row and column stand out.
- Step 8: Click “OK” to close the “Format Cells” dialog box.
- Step 9: Click “OK” again to close the “New Formatting Rule” dialog box.
Now, when you select any cell in the range, the entire row and column of the active cell will be highlighted with the yellow background color and black font color. However, I will happen only when worksheet will be calculated. To make it fully automated, we will use small VBA code.
Using VBA Code
Excel VBA is a programming language which allows you to automate tasks and customize Excel to your specific needs. You can use VBA code to recalculate the formula automatically whenever you select a cell in the table.
Below are the steps to add VBA code to your worksheet:
- Step 1: Press “Alt + F11” to open the VBA editor.
- Step 2: In the “Project” window, double-click on the worksheet wherein you want to add the code to.
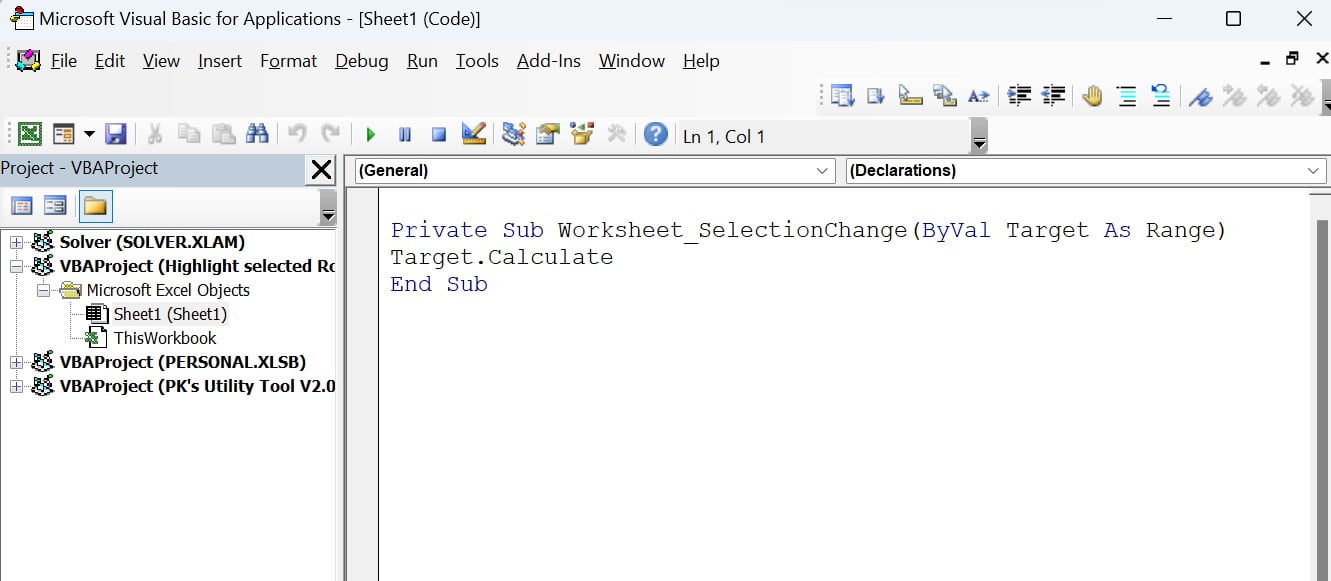
- Step 3: In the “Code” window, select “Worksheet” from the drop-down menu on the left.
- Step 4: Select “SelectionChange” from the drop-down menu on the right.
- Step 5: Enter the following code:
Private Sub Worksheet_SelectionChange(ByVal Target As Range)

    Target.Calculate

End Sub
- Step 6: Save your workbook as macro enabled.
Now, whenever you select a cell in the table, the formula will be recalculated automatically, and the selected row and column will be highlighted.
Not Recommended for Sheets with Many Formulas
We do not recommend this trick for the sheets wherein you have many formulas or complex formulas which take time to calculate. The code will recalculate every time you select a new cell, which can slow down your worksheet if you have a large amount of data.
Conclusion
Highlighting the row and column of the active cell in data can be a useful technique to make your data more readable and analysis friendly. With the help of conditional formatting and VBA code, you can automate this process and improve your workflow. However, it is important to note that the VBA code provided in this article may not be the best option for sheets with many formulas.