Charts are extremely useful to convey the information. Analyze the data points by charts are easy in compare of tables.
Below is the list of some basic charts available in Microsoft Excel.
Column Chart
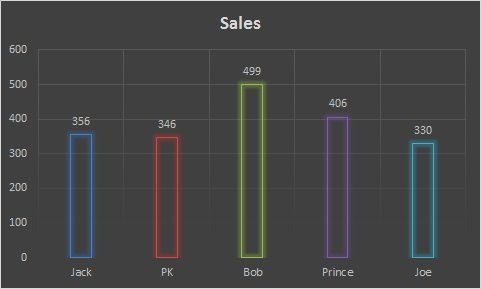
Column Charts are used to compare values by categories.
Pie Chart

Pie chart is used to display each category’s contribution parts of a whole number.
Stacked Column Chart
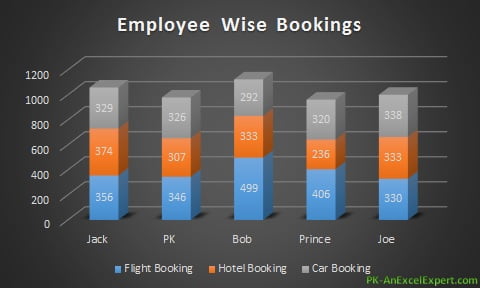
Stacked column chart is used to display bifurcation of multiple categories in columns.
Line Chart
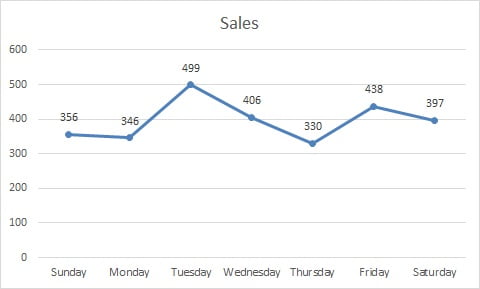
Line Chart is used to display the trend line of the data.
Doughnut Chart
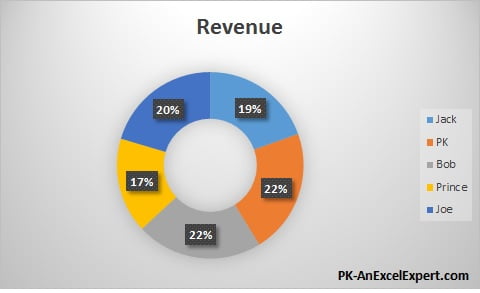
Doughnut Chart is also used to display each category’s contribution parts of a whole number.
Stacked Bar Chart
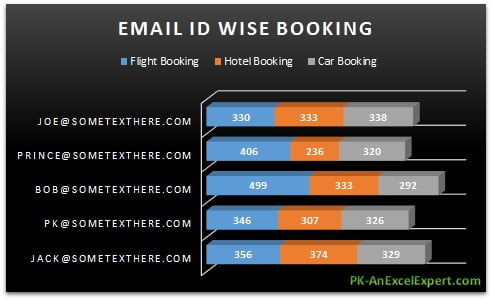
Stacked Bart chart is also used to display bifurcation of multiple categories in Bars. we use this chart when our category names are big.
Bar Chart
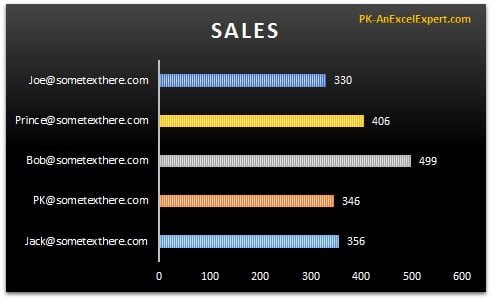
Bar Chart is like a horizontal column chart, It is used when category names are big.
Area Chart
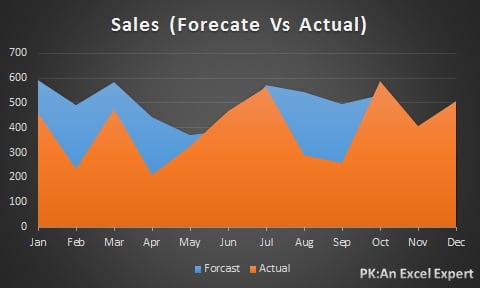
Area Chart is also used to show trends like a Line chart
Combo Chart
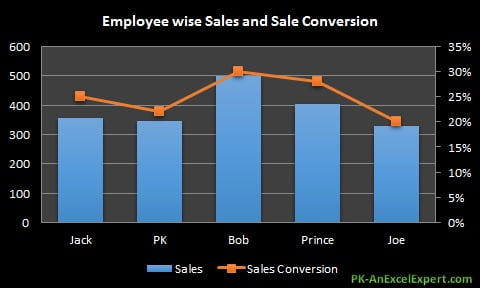
Combo Chart (Column + Line) chart can be used to to show two different/same type of data points for multiple categories.