New: NextGenTemplates Academy - video courses on Excel formulas with AI and Pivot Tables & dashboards. Early-bird: 20% off with code EARLYBIRD20 - first 20 orders only. See the courses →
  • Learn Excel (Free Course)
    • 1. Shortcut Keys
    • 2. Fill & Flash Fill
    • 3. Find & Replace
    • 4. Sort & Filter
    • 5. Formulas & Functions
    • 6. Data Validation
    • 7. Conditional Formatting
    • 8. Basic Charts
    • 9. Advanced Charts
    • 10. Pivot Tables
    • 11. Excel Dashboards
    • 12. VBA Course
    • 13. Excel Formulas with AI
  • Templates
  • Tutorials
    • Charts and Visualization
    • VBA
    • Excel Tips and Tricks
    • Excel Dashboards
    • Power Pivot & DAX
  • Power BI
  • Template Store
    • Ready to Use Templates
  • Courses
  • Academy
    • Excel + AI Mastery: 100 Formulas
    • Excel Pivot Tables & Dashboards
  • About Us
  • Contact Us

PK: An Excel Expert

Transforming Data into Decisions
Tag: performance dashboard

Dashboard

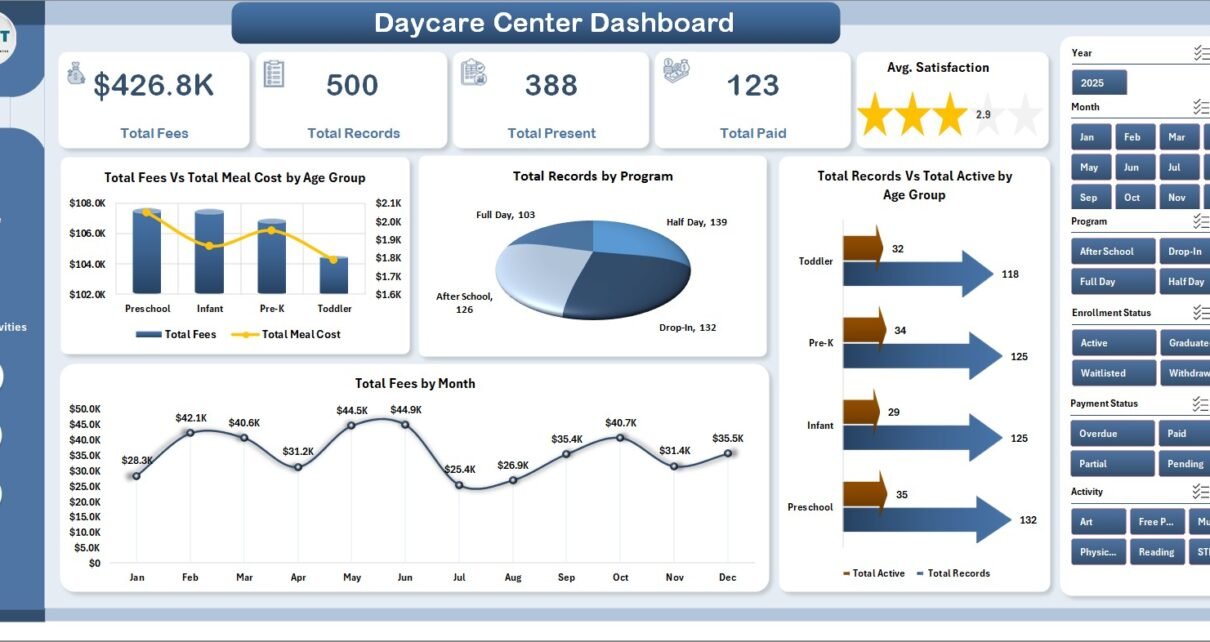
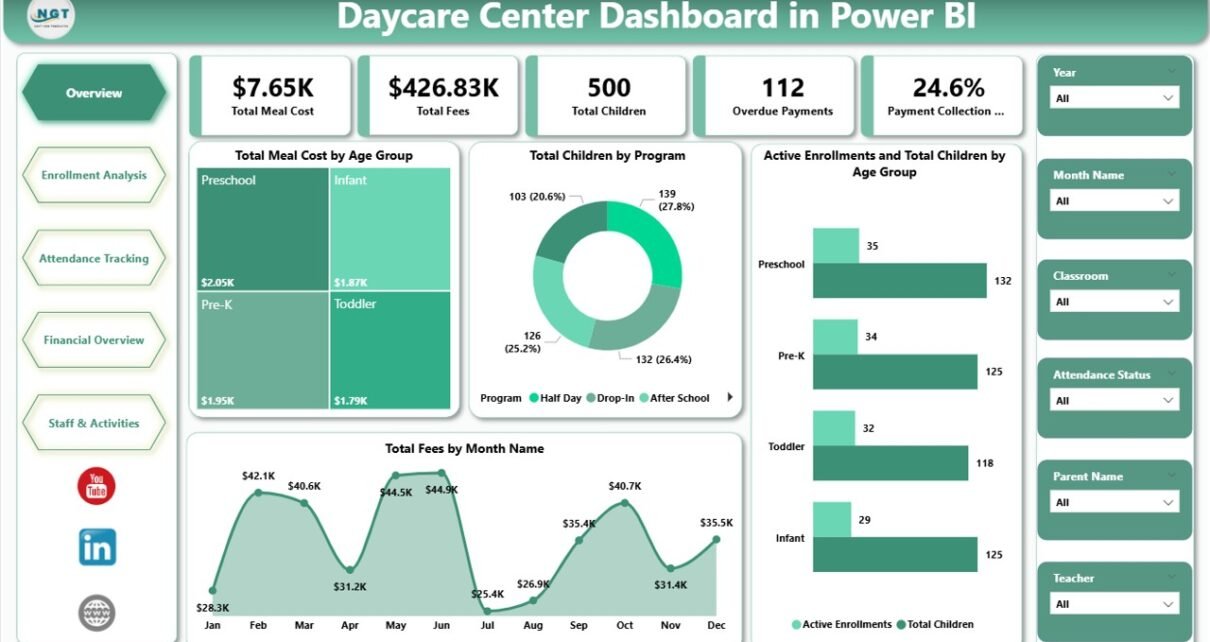
Daycare Center Dashboard in Power BI

May 17, 2026May 17, 2026 PKComments Off on Daycare Center Dashboard in Power BI
Running a daycare center is a daily juggling act. Owners and managers must track enrollment, attendance, fees, meal costs, teacher workload, and parent satisfaction — yet most centers still rely
Read More
Dashboard

Daycare Center Dashboard in Excel

May 17, 2026May 17, 2026 PKComments Off on Daycare Center Dashboard in Excel
Running a daycare center is a daily juggling act. Owners and managers must track enrollment, attendance, fees, meal costs, teacher workload, and parent satisfaction — yet most centers still rely
Read More
Power Pivot

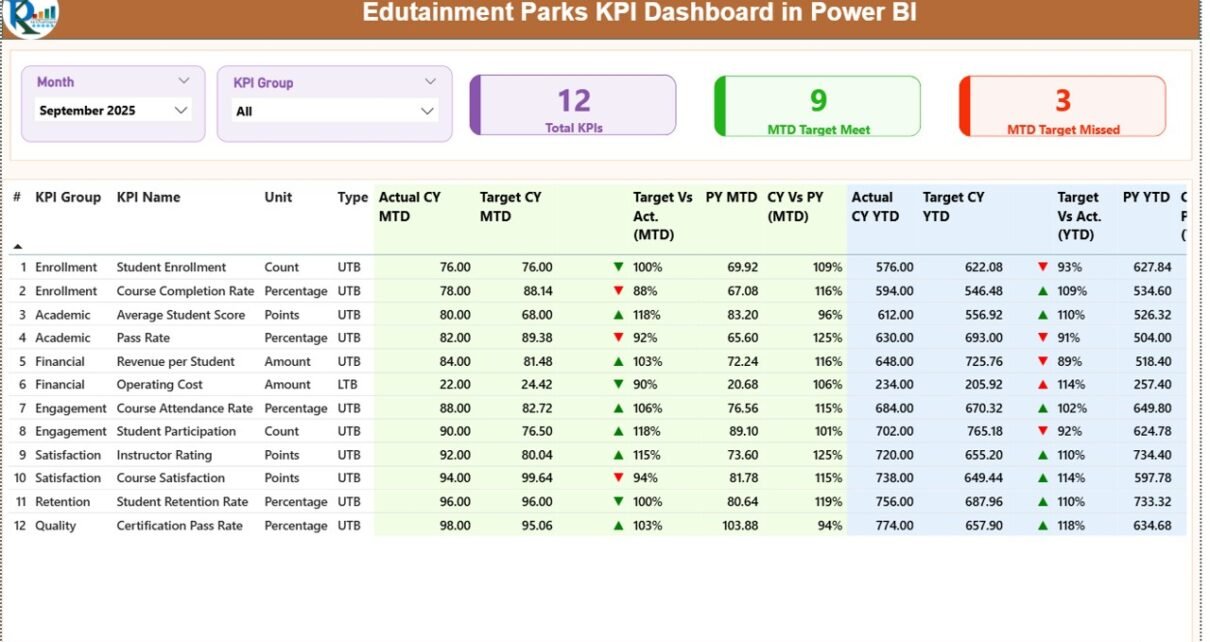
Edutainment Parks KPI Dashboard in Power BI

March 26, 2026March 26, 2026 PKComments Off on Edutainment Parks KPI Dashboard in Power BI
In today’s competitive entertainment industry, edutainment parks must balance fun, learning, and profitability. However, managing operations, tracking visitor performance, and analyzing revenue can quickly become overwhelming. So, how can you
Read More
Power BI

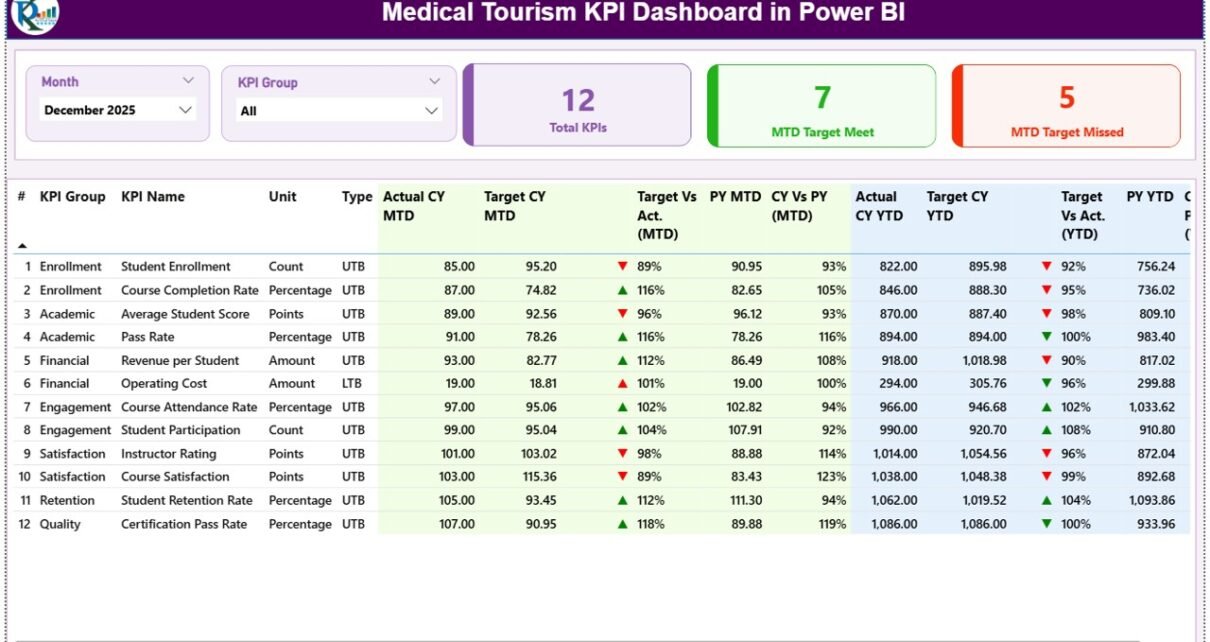
Medical Tourism KPI Dashboard in Power BI

March 26, 2026March 26, 2026 PKComments Off on Medical Tourism KPI Dashboard in Power BI
In today’s global healthcare environment, medical tourism has become a fast-growing industry. Patients travel across countries to receive high-quality and cost-effective treatments. However, managing this complex ecosystem requires accurate data
Read More
Dashboard

Augmented Analytics Dashboard in Excel

March 20, 2026March 20, 2026 PKComments Off on Augmented Analytics Dashboard in Excel
In today’s fast-moving digital world, businesses generate massive amounts of data every single day. However, many organizations still struggle to turn this data into meaningful insights. As a result, decision-making
Read More
Dashboard

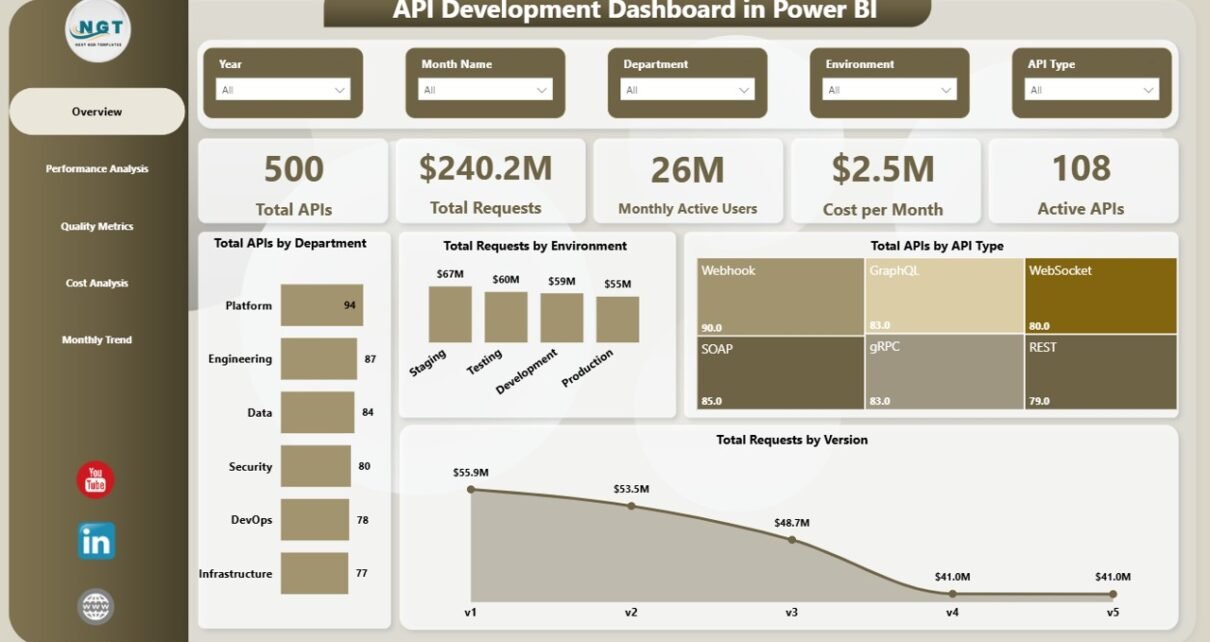
API Development Dashboard in Power BI

March 18, 2026March 18, 2026 PKComments Off on API Development Dashboard in Power BI
In today’s competitive automotive industry, manufacturers must track production efficiency, quality, costs, and operational performance in real time. However, many organizations still rely on scattered spreadsheets and disconnected reports. As
Read More
Dashboard Power BI

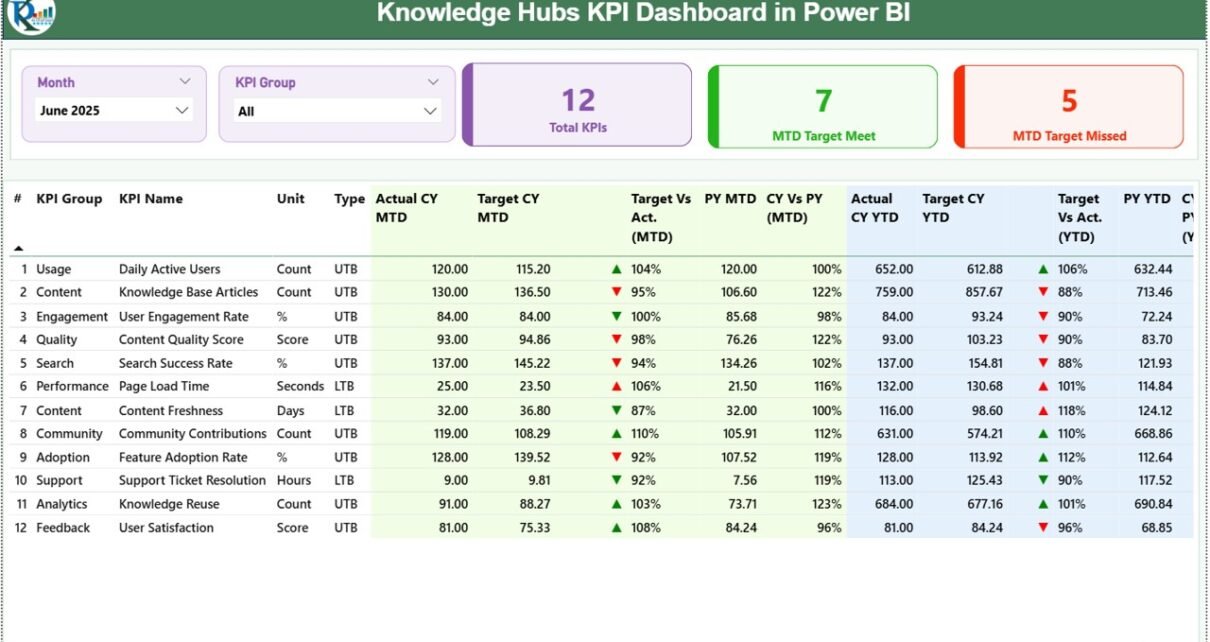
Knowledge Hubs KPI Dashboard in Power BI

March 10, 2026March 10, 2026 PKComments Off on Knowledge Hubs KPI Dashboard in Power BI
Modern organizations rely heavily on data-driven decision-making. Therefore, tracking performance using Key Performance Indicators (KPIs) has become essential for businesses, knowledge centers, and service organizations. However, many teams still struggle
Read More
Dashboard Power BI

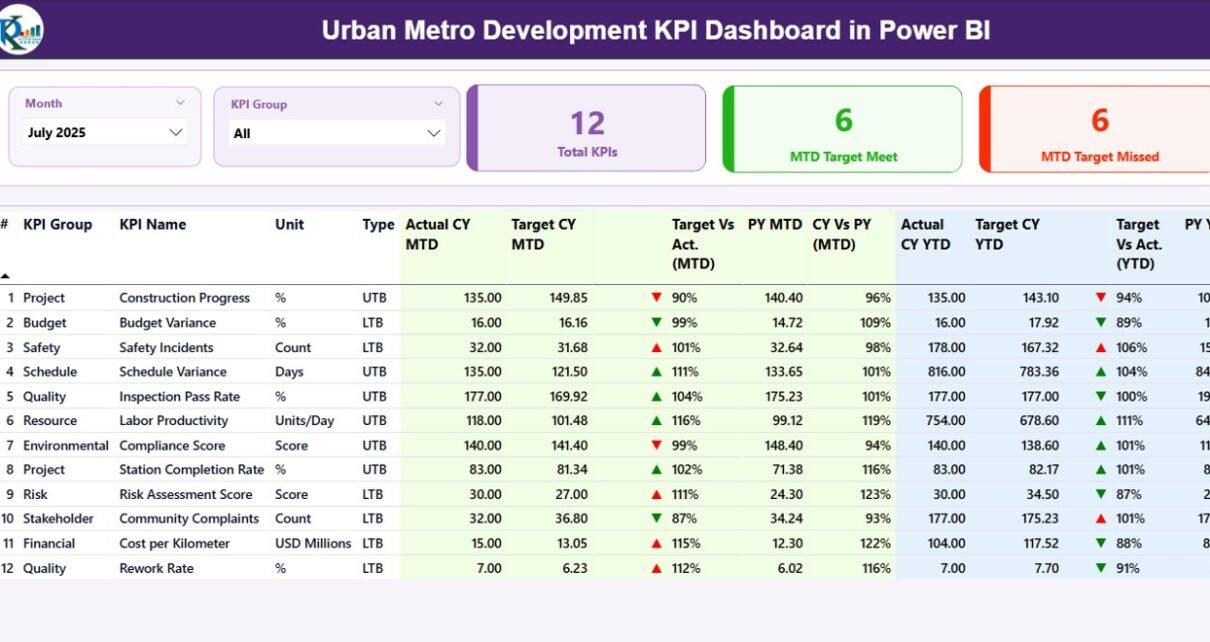
Urban Metro Development KPI Dashboard in Power BI

March 8, 2026March 8, 2026 PKComments Off on Urban Metro Development KPI Dashboard in Power BI
Urban transportation systems continue to expand rapidly as cities grow and populations increase. Because millions of people rely on metro systems every day, transportation authorities must manage complex metro development
Read More
Dashboard

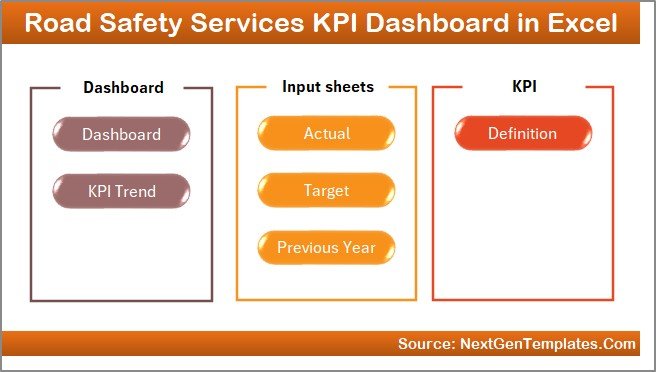
Road Safety Services KPI Dashboard in Excel

March 6, 2026March 6, 2026 PKComments Off on Road Safety Services KPI Dashboard in Excel
Road safety management plays a critical role in protecting lives, improving traffic control, and reducing accidents on roads. However, many road safety departments still manage performance data using scattered spreadsheets,
Read More
Dashboard

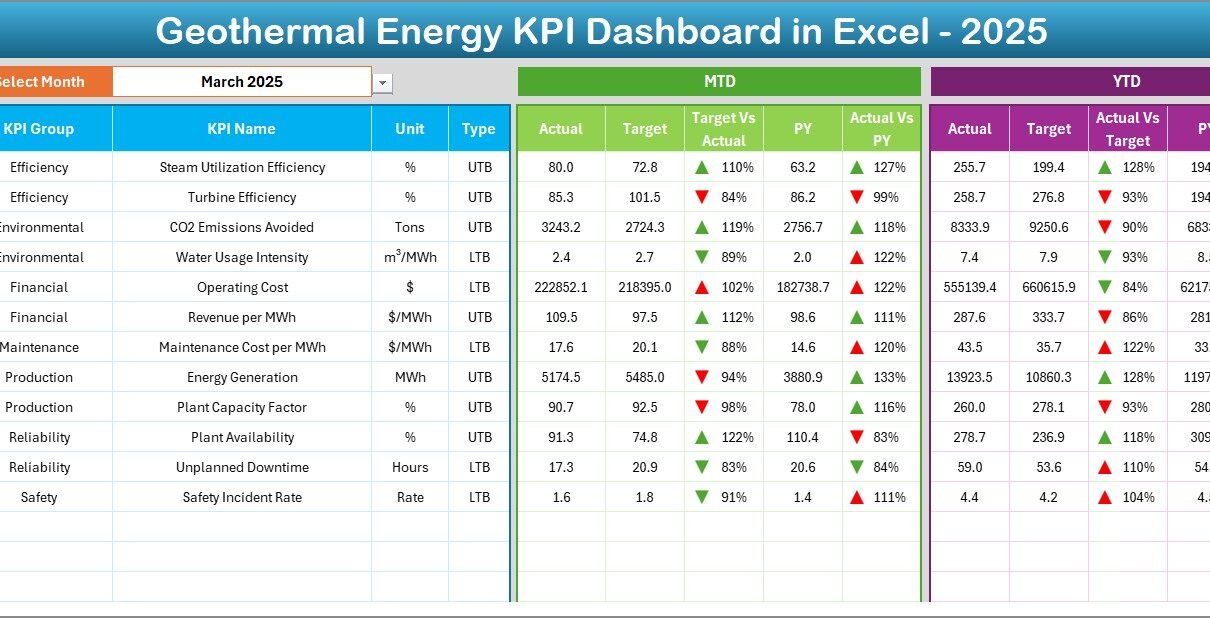
Geothermal Energy KPI Dashboard in Excel

March 2, 2026March 2, 2026 PKComments Off on Geothermal Energy KPI Dashboard in Excel
The renewable energy industry continues to expand rapidly. Among all clean energy sources, geothermal energy stands out because it provides stable, continuous, and environmentally friendly power generation. However, managing geothermal
Read More

Posts pagination

1 2 … 9 Next
  • Learn Excel (Free Course)
    • 1. Shortcut Keys
    • 2. Fill & Flash Fill
    • 3. Find & Replace
    • 4. Sort & Filter
    • 5. Formulas & Functions
    • 6. Data Validation
    • 7. Conditional Formatting
    • 8. Basic Charts
    • 9. Advanced Charts
    • 10. Pivot Tables
    • 11. Excel Dashboards
    • 12. VBA Course
    • 13. Excel Formulas with AI
  • Templates
  • Tutorials
    • Charts and Visualization
    • VBA
    • Excel Tips and Tricks
    • Excel Dashboards
    • Power Pivot & DAX
  • Power BI
  • Template Store
    • Ready to Use Templates
  • Courses
  • Academy
    • Excel + AI Mastery: 100 Formulas
    • Excel Pivot Tables & Dashboards
  • About Us
  • Contact Us
Copyright © 2023 PK-AnExcelExpert.com - Privacy Policy