New: NextGenTemplates Academy - video courses on Excel formulas with AI and Pivot Tables & dashboards. Early-bird: 20% off with code EARLYBIRD20 - first 20 orders only. See the courses →
  • Learn Excel (Free Course)
    • 1. Shortcut Keys
    • 2. Fill & Flash Fill
    • 3. Find & Replace
    • 4. Sort & Filter
    • 5. Formulas & Functions
    • 6. Data Validation
    • 7. Conditional Formatting
    • 8. Basic Charts
    • 9. Advanced Charts
    • 10. Pivot Tables
    • 11. Excel Dashboards
    • 12. VBA Course
    • 13. Excel Formulas with AI
  • Templates
  • Tutorials
    • Charts and Visualization
    • VBA
    • Excel Tips and Tricks
    • Excel Dashboards
    • Power Pivot & DAX
  • Power BI
  • Template Store
    • Ready to Use Templates
  • Courses
  • Academy
    • Excel + AI Mastery: 100 Formulas
    • Excel Pivot Tables & Dashboards
  • About Us
  • Contact Us

PK: An Excel Expert

Transforming Data into Decisions

Tag: performance dashboard

Dashboard Power BI

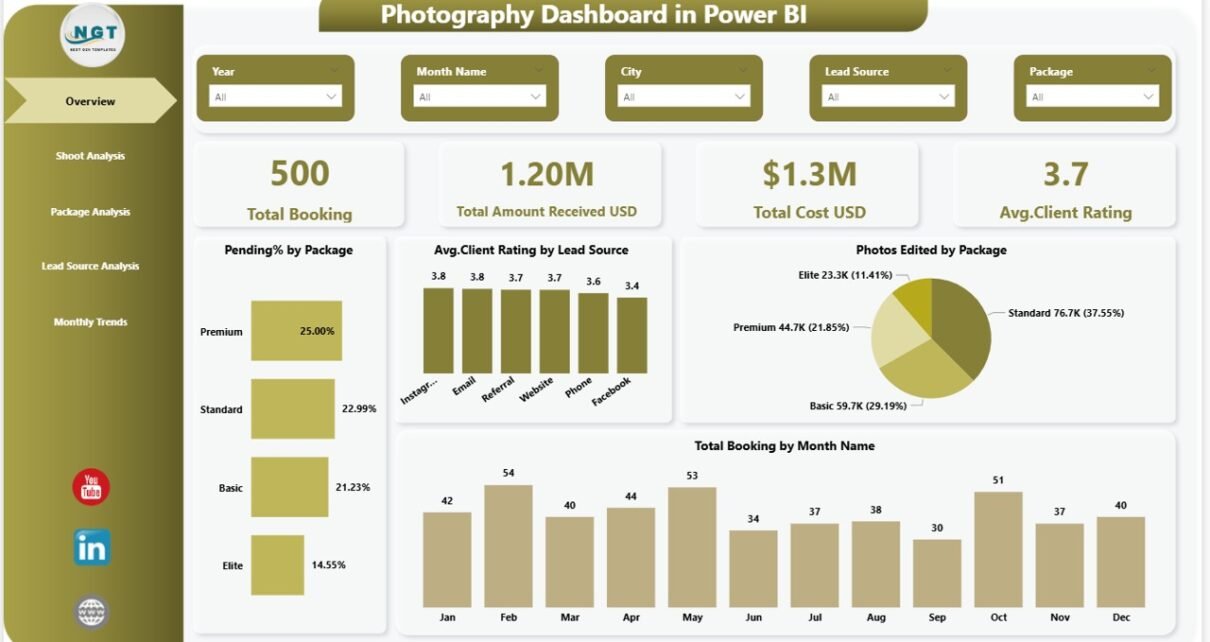
Photography Dashboard in Power BI

March 1, 2026March 1, 2026 PKComments Off on Photography Dashboard in Power BI
Running a photography business involves much more than taking beautiful pictures. You must manage bookings, track payments, monitor editing progress, evaluate client satisfaction, and analyse marketing performance. However, many photographers
Read More
Dashboard Power BI

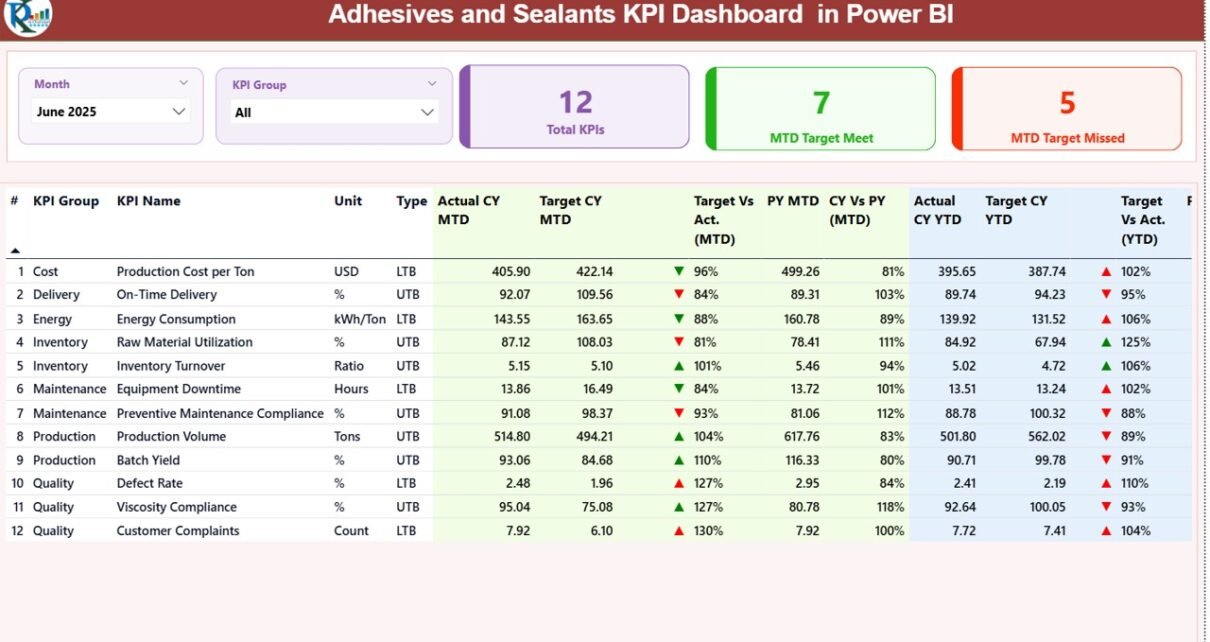
Adhesives and Sealants KPI Dashboard in Power BI

February 27, 2026February 27, 2026 PKComments Off on Adhesives and Sealants KPI Dashboard in Power BI
In today’s fast-moving manufacturing environment, companies must monitor performance continuously to stay competitive. The adhesives and sealants industry operates with complex production processes, strict quality standards, and cost-sensitive operations. Therefore,
Read More
Dashboard Power BI

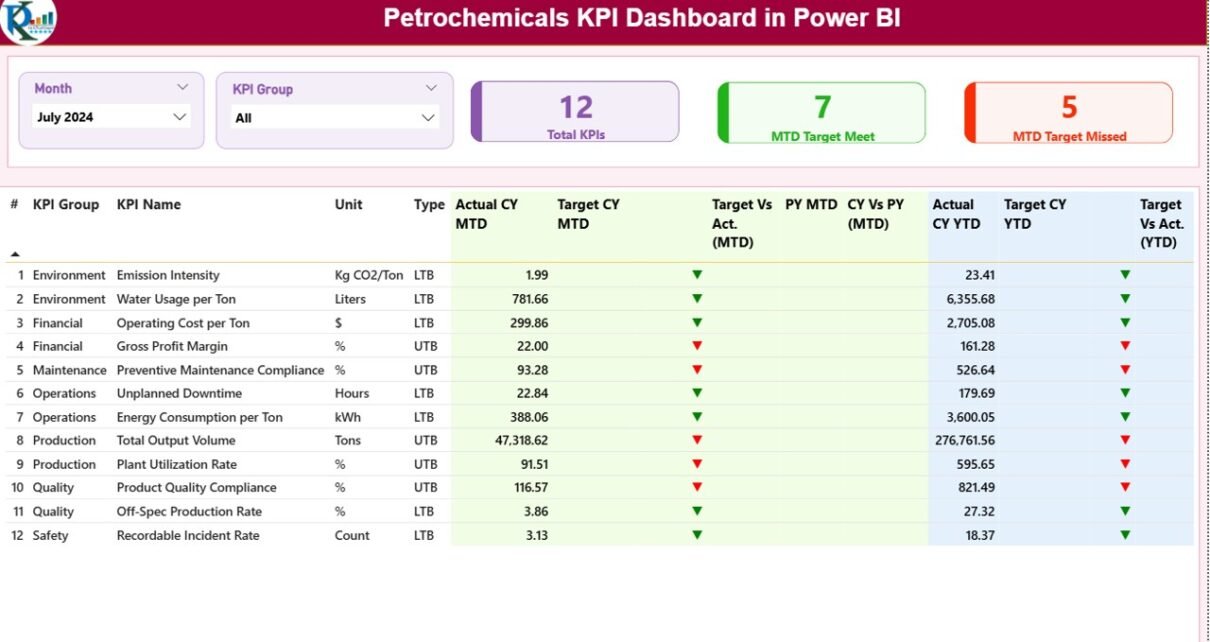
Petrochemicals KPI Dashboard in Power BI

February 26, 2026February 26, 2026 PKComments Off on Petrochemicals KPI Dashboard in Power BI
The petrochemical industry operates in a highly competitive and performance-driven environment. Companies must monitor production efficiency, operational reliability, safety compliance, cost control, and financial performance continuously. However, many organizations still
Read More
Dashboard Power BI

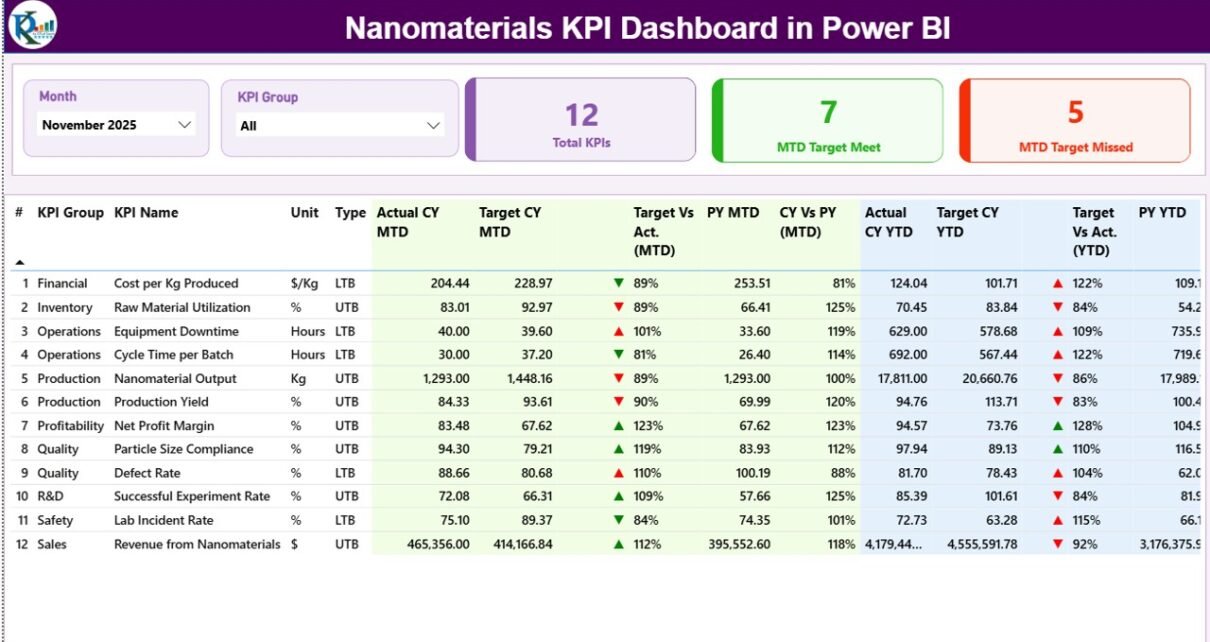
Nanomaterials KPI Dashboard in Power BI

February 26, 2026February 26, 2026 PKComments Off on Nanomaterials KPI Dashboard in Power BI
Modern nanotechnology organizations operate in a highly data-driven environment. Companies involved in nanomaterials research, manufacturing, and commercialization must continuously monitor performance indicators such as production efficiency, material quality, research output,
Read More
Dashboard

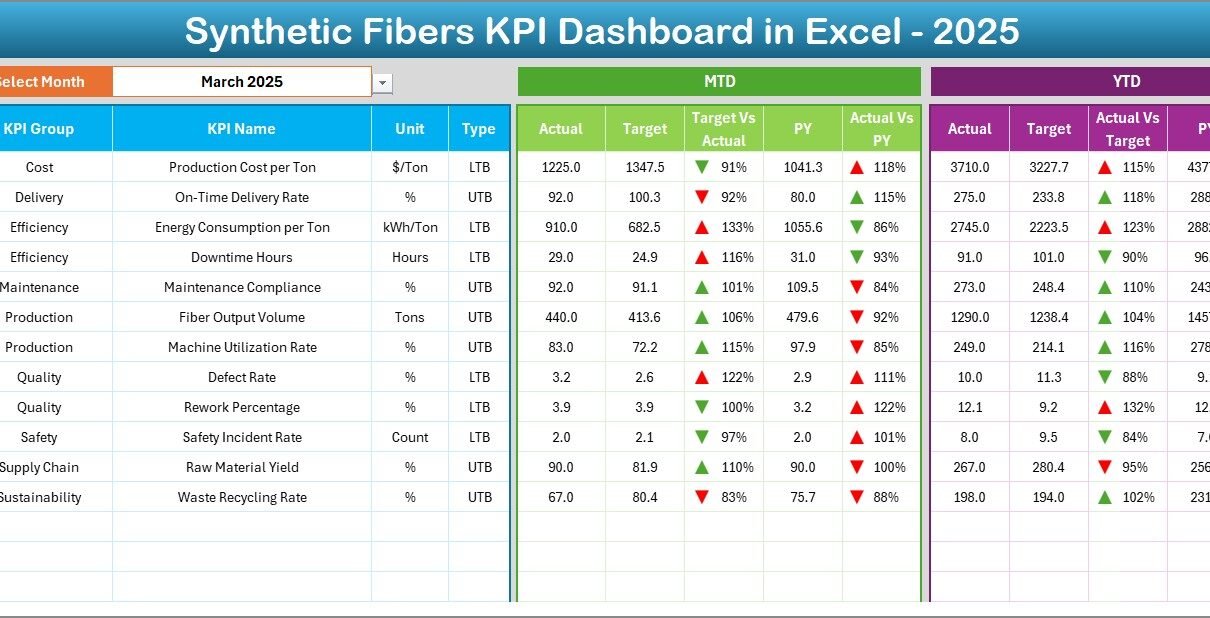
Synthetic Fibers KPI Dashboard in Excel

February 26, 2026February 26, 2026 PKComments Off on Synthetic Fibers KPI Dashboard in Excel
Modern manufacturing industries operate in a highly competitive and data-driven environment. Synthetic fiber manufacturers must continuously monitor production efficiency, quality performance, operational costs, and delivery timelines. However, many organizations still
Read More
Dashboard Power BI

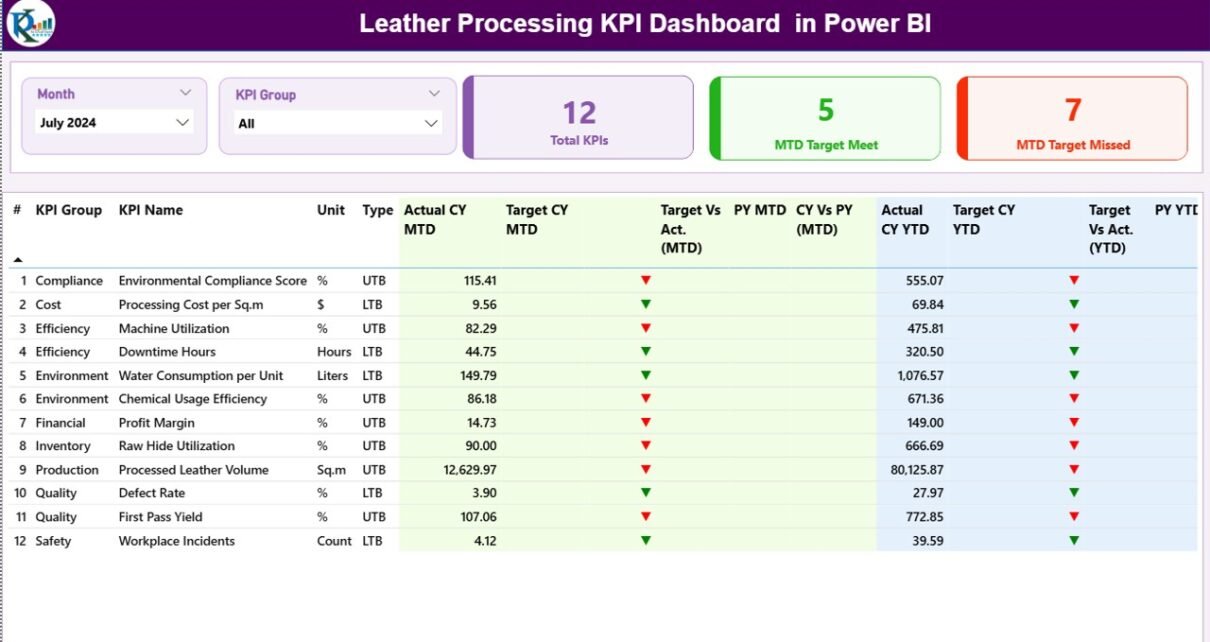
Leather Processing KPI Dashboard in Power BI

February 24, 2026February 24, 2026 PKComments Off on Leather Processing KPI Dashboard in Power BI
The leather industry plays a vital role in global manufacturing. Companies process raw hides into finished leather products used in footwear, furniture, automotive interiors, garments, and accessories. However, leather processing
Read More
Dashboard

Automotive Parts Manufacturing KPI Dashboard in Excel

February 22, 2026February 22, 2026 PKComments Off on Automotive Parts Manufacturing KPI Dashboard in Excel
The automotive parts manufacturing industry operates in a highly competitive and precision-driven environment. Manufacturers must manage production efficiency, quality standards, machine utilization, delivery timelines, inventory levels, and operational costs simultaneously.
Read More
Dashboard

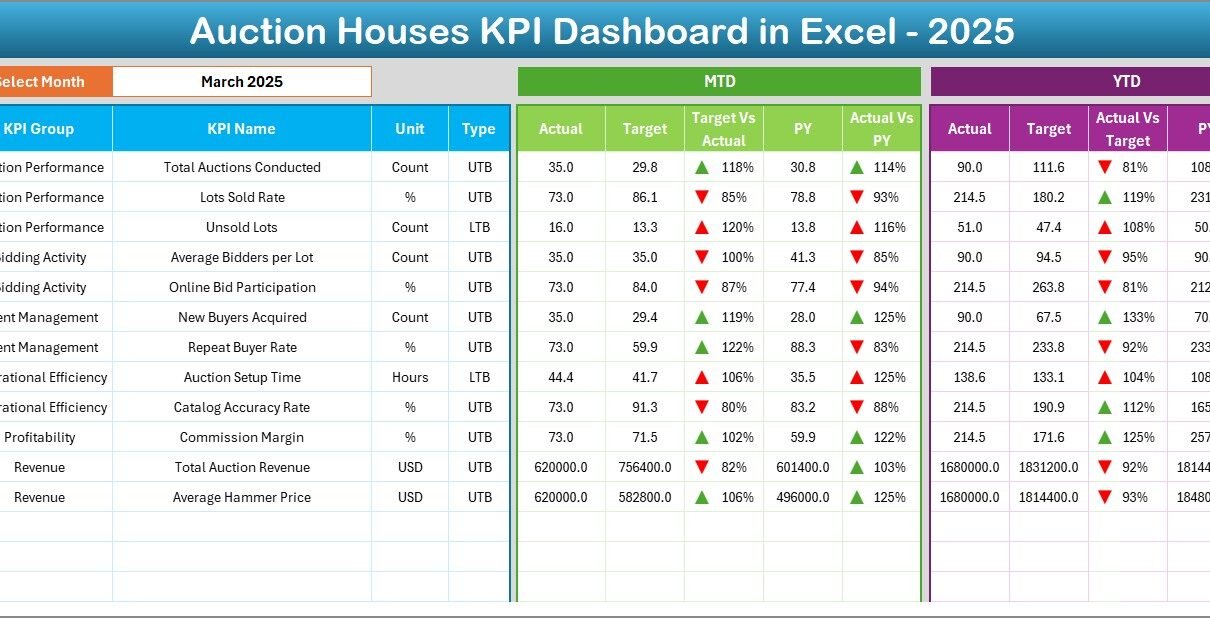
Auction Houses KPI Dashboard in Excel

February 22, 2026February 22, 2026 PKComments Off on Auction Houses KPI Dashboard in Excel
Auction houses operate in a fast-moving and highly competitive environment. Every auction event involves consignors, bidders, inventory valuation, commissions, marketing costs, and final hammer prices. Therefore, auction managers must track
Read More
Templates

Influencer Marketing KPI Scorecard In Excel

February 21, 2026February 21, 2026 PKComments Off on Influencer Marketing KPI Scorecard In Excel
Influencer marketing has become one of the most powerful digital marketing strategies today. Brands collaborate with influencers to increase awareness, build trust, and drive sales. However, many businesses still struggle
Read More
Dashboard

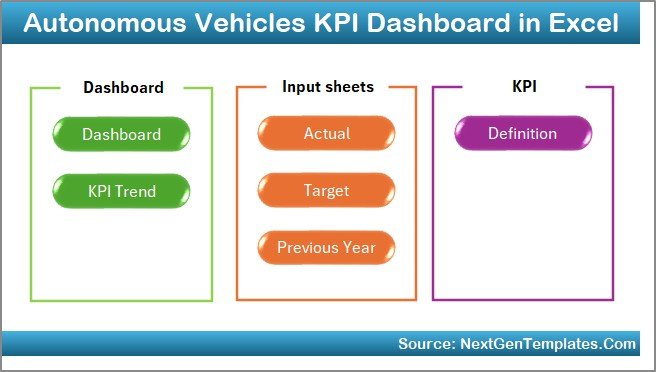
Autonomous Vehicles KPI Dashboard in Excel

January 20, 2026January 20, 2026 PKComments Off on Autonomous Vehicles KPI Dashboard in Excel
The autonomous vehicle industry evolves at a rapid pace. Every day, companies test new algorithms, deploy sensors, analyze driving data, and improve safety systems. However, despite advanced technology, many teams
Read More

Posts pagination

Previous 1 2 3 … 9 Next
  • Learn Excel (Free Course)
    • 1. Shortcut Keys
    • 2. Fill & Flash Fill
    • 3. Find & Replace
    • 4. Sort & Filter
    • 5. Formulas & Functions
    • 6. Data Validation
    • 7. Conditional Formatting
    • 8. Basic Charts
    • 9. Advanced Charts
    • 10. Pivot Tables
    • 11. Excel Dashboards
    • 12. VBA Course
    • 13. Excel Formulas with AI
  • Templates
  • Tutorials
    • Charts and Visualization
    • VBA
    • Excel Tips and Tricks
    • Excel Dashboards
    • Power Pivot & DAX
  • Power BI
  • Template Store
    • Ready to Use Templates
  • Courses
  • Academy
    • Excel + AI Mastery: 100 Formulas
    • Excel Pivot Tables & Dashboards
  • About Us
  • Contact Us
Copyright © 2023 PK-AnExcelExpert.com - Privacy Policy