New: NextGenTemplates Academy - video courses on Excel formulas with AI and Pivot Tables & dashboards. Early-bird: 20% off with code EARLYBIRD20 - first 20 orders only. See the courses →
  • Learn Excel (Free Course)
    • 1. Shortcut Keys
    • 2. Fill & Flash Fill
    • 3. Find & Replace
    • 4. Sort & Filter
    • 5. Formulas & Functions
    • 6. Data Validation
    • 7. Conditional Formatting
    • 8. Basic Charts
    • 9. Advanced Charts
    • 10. Pivot Tables
    • 11. Excel Dashboards
    • 12. VBA Course
    • 13. Excel Formulas with AI
  • Templates
  • Tutorials
    • Charts and Visualization
    • VBA
    • Excel Tips and Tricks
    • Excel Dashboards
    • Power Pivot & DAX
  • Power BI
  • Template Store
    • Ready to Use Templates
  • Courses
  • Academy
    • Excel + AI Mastery: 100 Formulas
    • Excel Pivot Tables & Dashboards
  • About Us
  • Contact Us

PK: An Excel Expert

Transforming Data into Decisions

Tag: performance dashboard

Dashboard

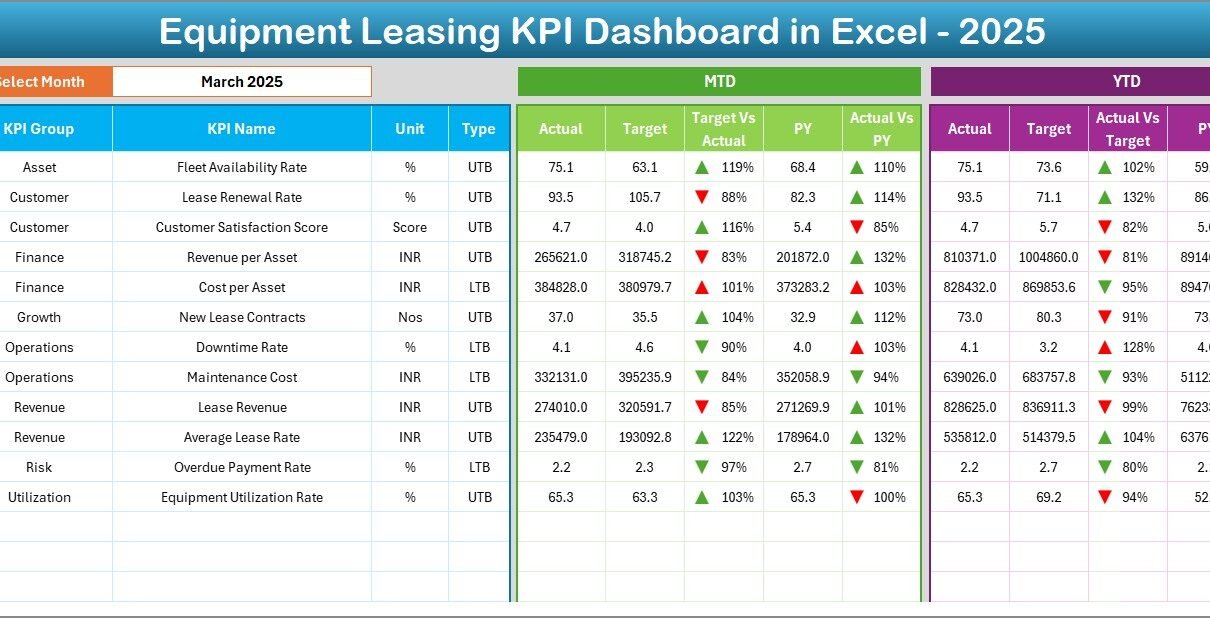
Equipment Leasing KPI Dashboard in Excel

January 18, 2026January 18, 2026 PKComments Off on Equipment Leasing KPI Dashboard in Excel
Managing an equipment leasing business involves constant tracking of assets, revenue, utilization, costs, and profitability. However, many leasing companies still rely on scattered Excel sheets, manual reports, and delayed summaries.
Read More
Dashboard Power BI

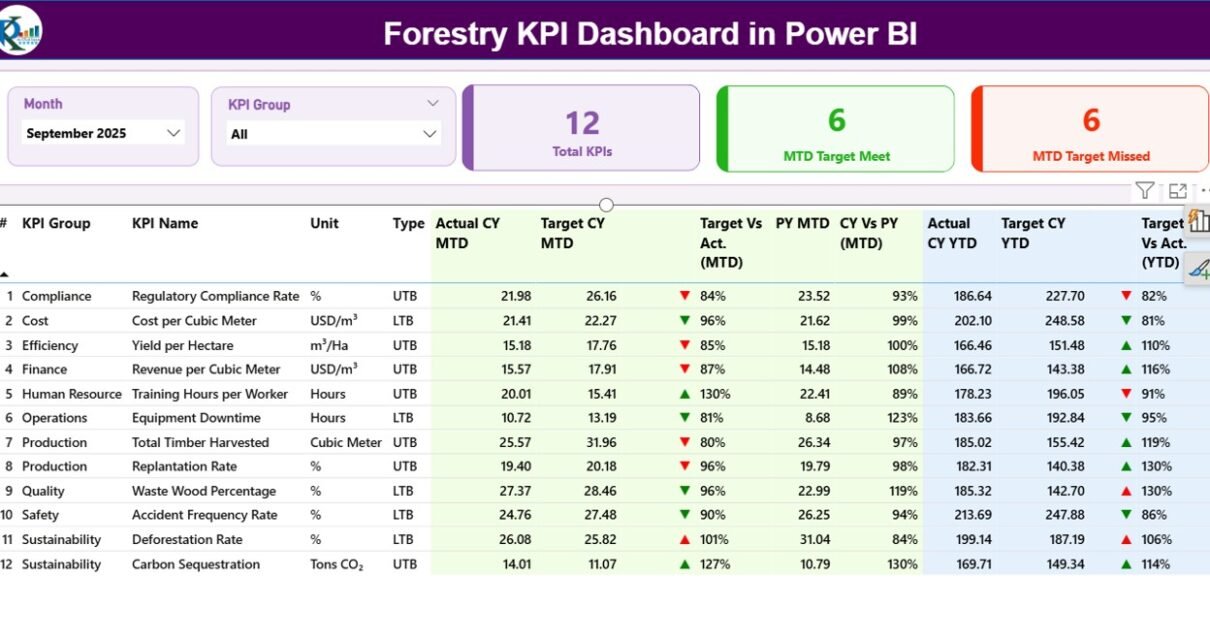
Forestry KPI Dashboard in Power BI

January 17, 2026October 10, 2026 PKComments Off on Forestry KPI Dashboard in Power BI
Forestry organizations operate in a complex environment. On one side, they manage natural resources responsibly. On the other side, they must meet productivity, sustainability, safety, and compliance goals. Therefore, forestry
Read More
Dashboard

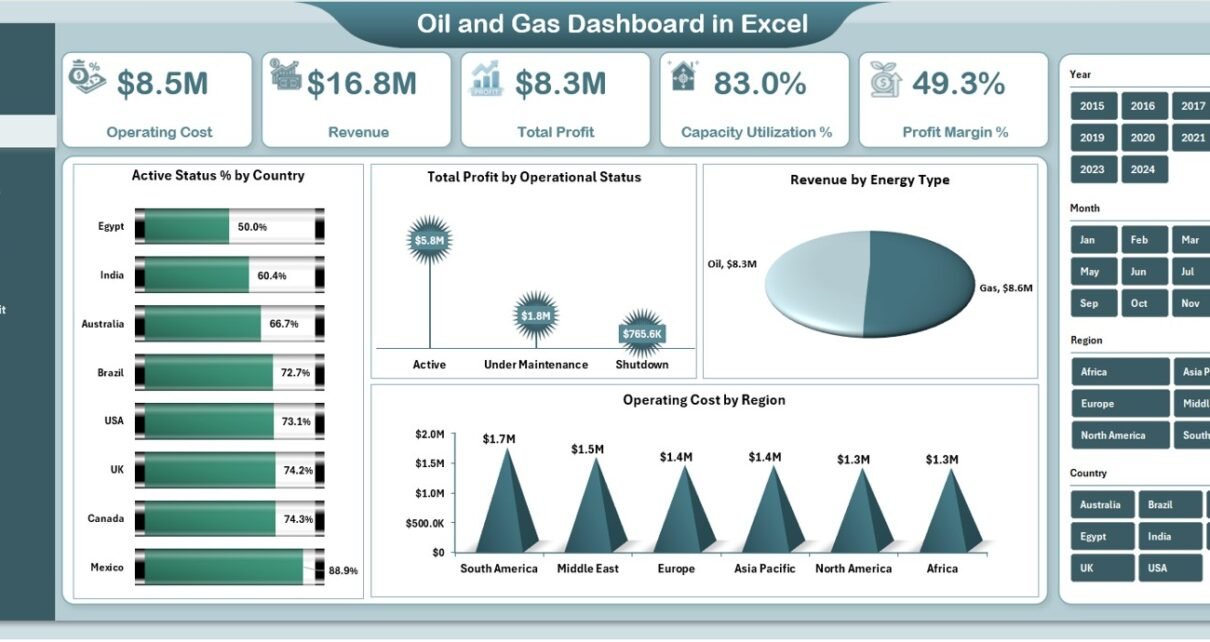
Oil and Gas Dashboard in Excel

January 15, 2026January 15, 2026 PKComments Off on Oil and Gas Dashboard in Excel
The oil and gas industry operates in one of the most complex and capital-intensive environments in the world. Every day, organizations deal with fluctuating energy prices, high operating costs, production
Read More
Dashboard

Community Development KPI Dashboard in Excel

January 12, 2026January 12, 2026 PKComments Off on Community Development KPI Dashboard in Excel
Community development projects focus on improving lives, strengthening social systems, and creating long-term impact. However, measuring progress in community programs often becomes challenging because data remains scattered across reports, registers,
Read More
Dashboard

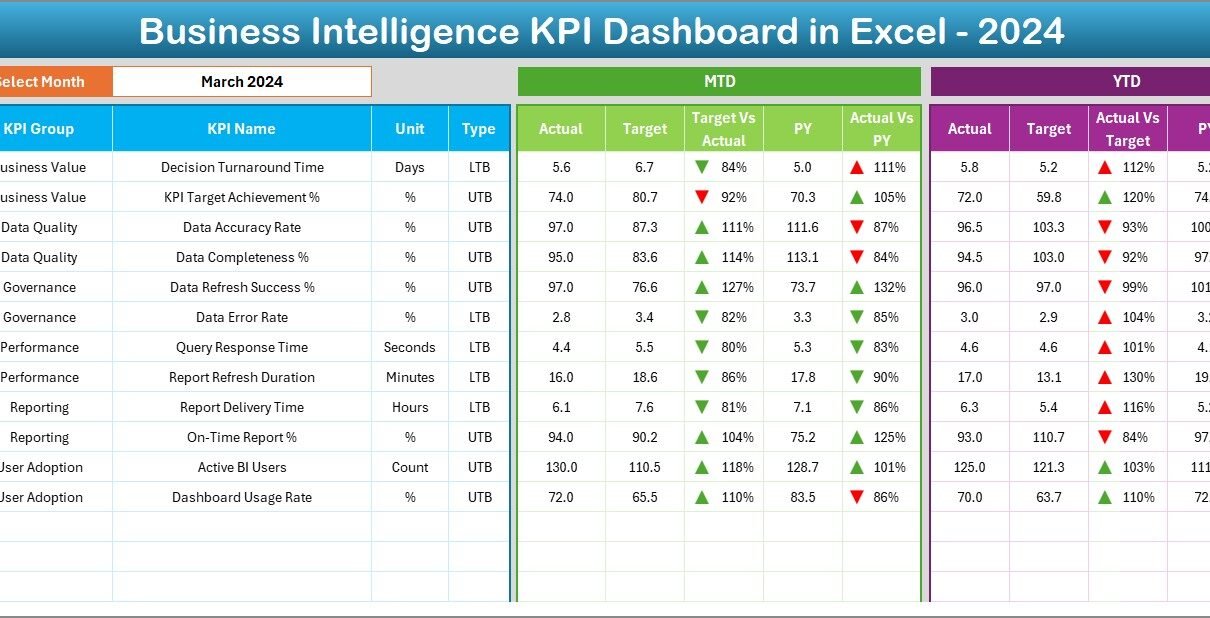
Business Intelligence (BI) KPI Dashboard in Excel

January 12, 2026January 12, 2026 PKComments Off on Business Intelligence (BI) KPI Dashboard in Excel
In today’s fast-changing business environment, data drives every important decision. However, many organizations still struggle to convert raw data into meaningful insights. As a result, managers waste time reviewing multiple
Read More
Dashboard

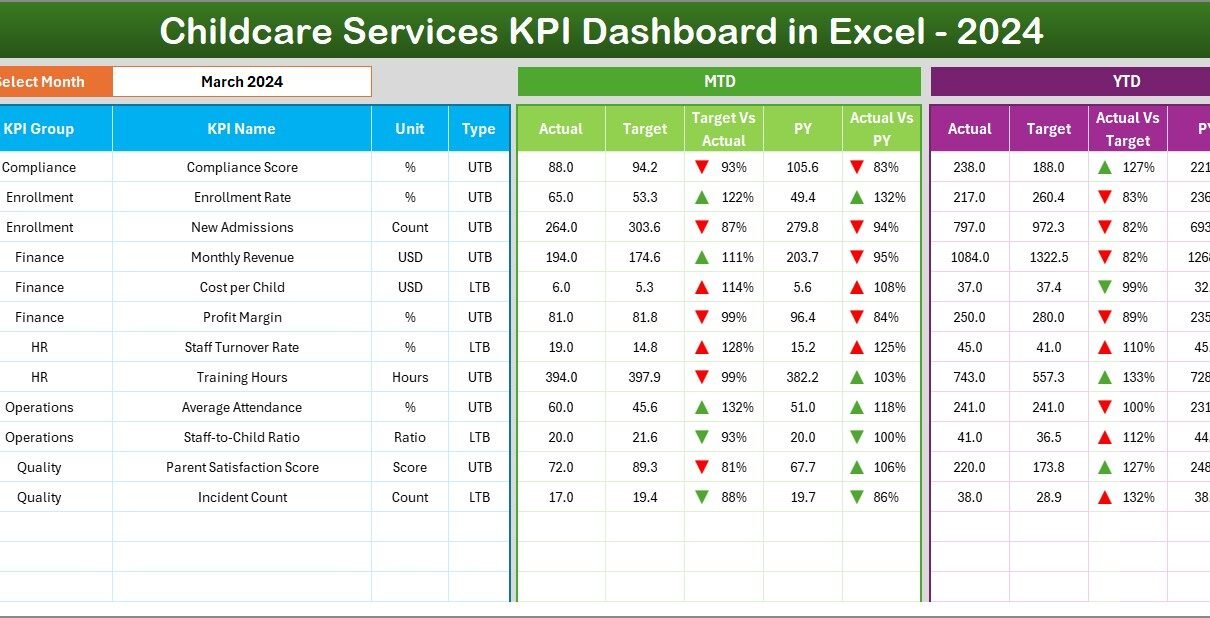
Childcare Services KPI Dashboard in Excel

January 12, 2026January 12, 2026 PKComments Off on Childcare Services KPI Dashboard in Excel
Managing a childcare or daycare service involves much more than daily operations and parent communication. You must track enrollments, attendance, staff efficiency, safety, finances, and service quality regularly. However, many
Read More
Dashboard Power BI

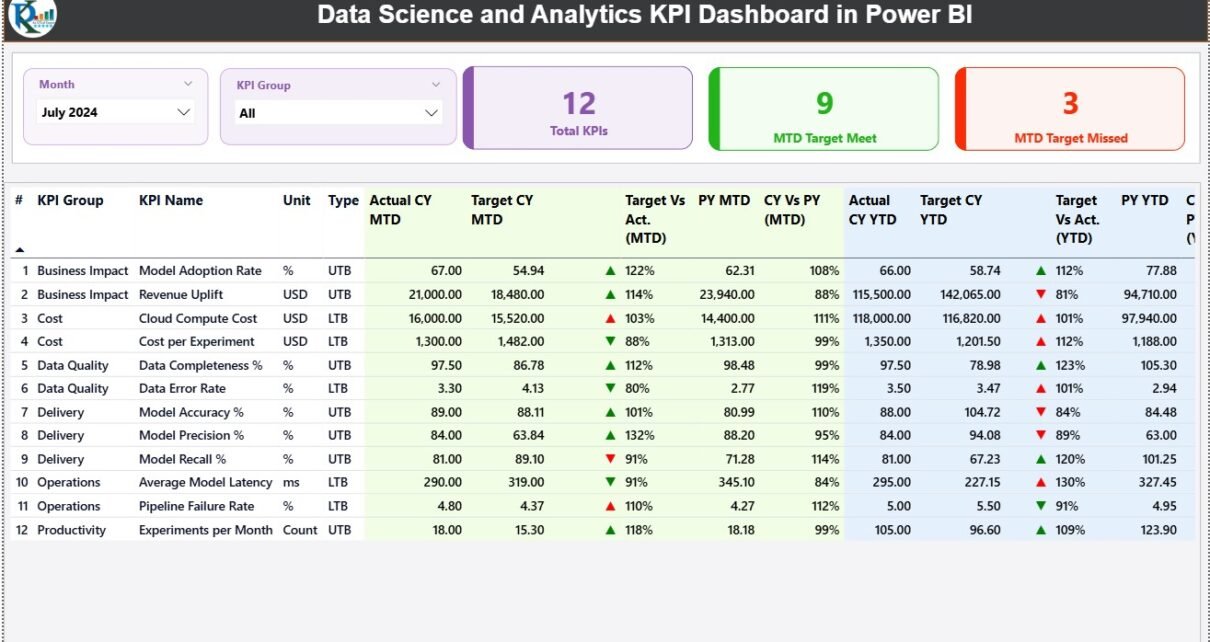
Data Science and Analytics KPI Dashboard in Power BI

January 12, 2026January 12, 2026 PKComments Off on Data Science and Analytics KPI Dashboard in Power BI
In today’s fast-moving, data-driven world, data science and analytics teams face constant pressure to deliver insights faster, track performance accurately, and explain results clearly to stakeholders. However, many teams still
Read More
Dashboard

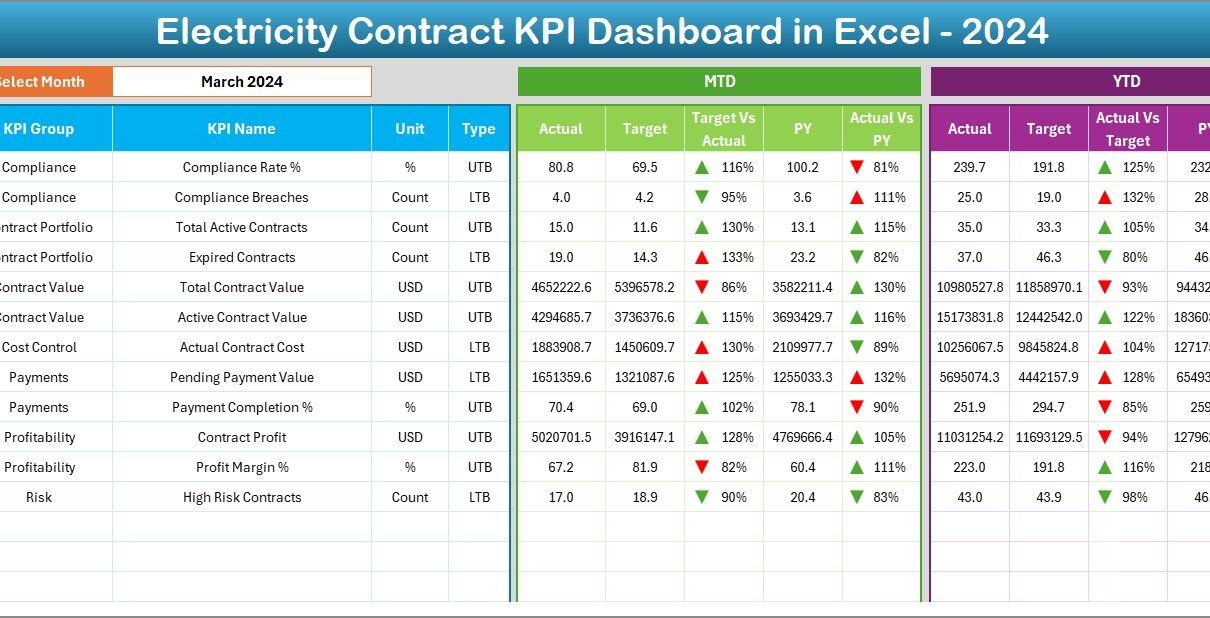
Electricity Contract KPI Dashboard in Excel

December 26, 2025December 26, 2025 PKComments Off on Electricity Contract KPI Dashboard in Excel
Managing electricity contracts without a structured performance system often creates confusion, delays, and missed targets. Many organizations still depend on scattered Excel sheets, emails, and manual reports. As a result,
Read More
Dashboard Power BI

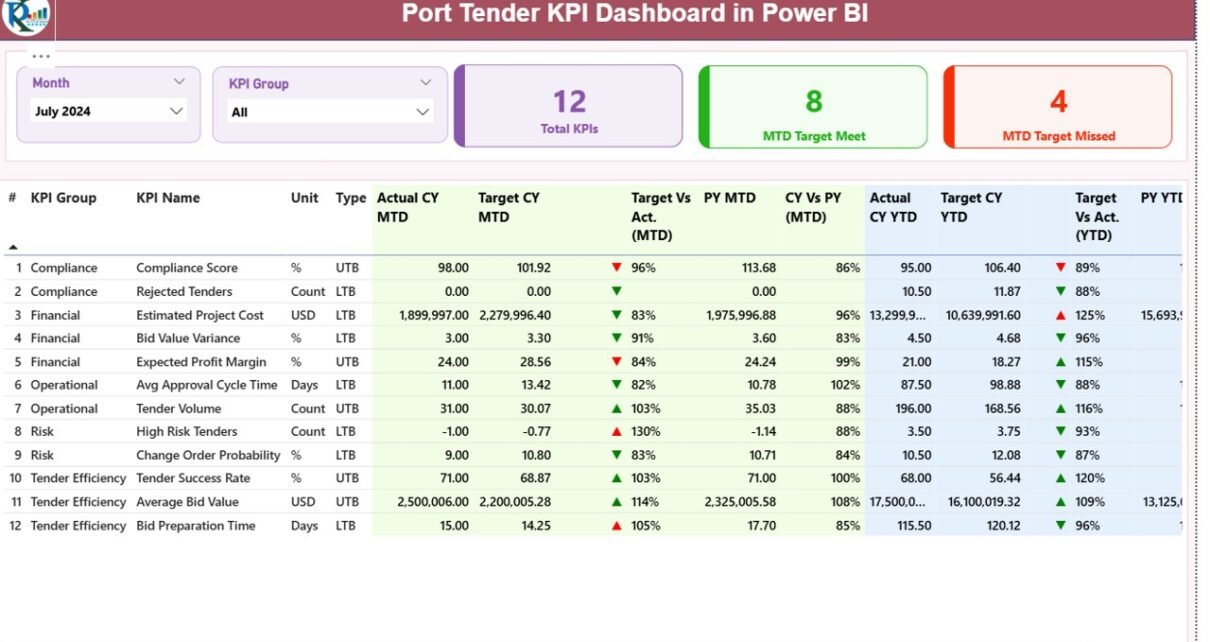
Port Tender KPI Dashboard in Power BI

December 25, 2025October 10, 2026 PKComments Off on Port Tender KPI Dashboard in Power BI
Managing port tenders involves complex processes, strict compliance, multiple stakeholders, and continuous performance monitoring. However, when organizations rely only on spreadsheets or manual tracking, they often face delays, errors, and
Read More
Dashboard

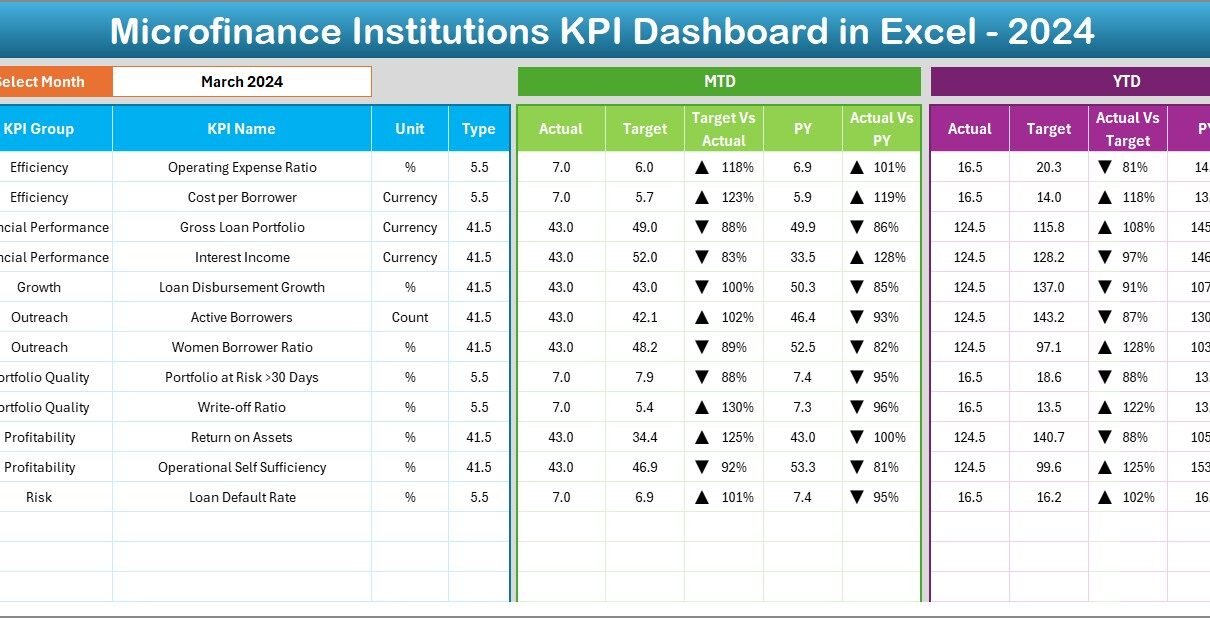
Microfinance Institutions KPI Dashboard in Excel

December 23, 2025December 23, 2025 PKComments Off on Microfinance Institutions KPI Dashboard in Excel
Managing performance in microfinance institutions requires clarity, accuracy, and speed. However, many microfinance teams still rely on scattered Excel sheets, manual reports, and delayed summaries. As a result, decision-making becomes
Read More

Posts pagination

Previous 1 2 3 4 … 9 Next
  • Learn Excel (Free Course)
    • 1. Shortcut Keys
    • 2. Fill & Flash Fill
    • 3. Find & Replace
    • 4. Sort & Filter
    • 5. Formulas & Functions
    • 6. Data Validation
    • 7. Conditional Formatting
    • 8. Basic Charts
    • 9. Advanced Charts
    • 10. Pivot Tables
    • 11. Excel Dashboards
    • 12. VBA Course
    • 13. Excel Formulas with AI
  • Templates
  • Tutorials
    • Charts and Visualization
    • VBA
    • Excel Tips and Tricks
    • Excel Dashboards
    • Power Pivot & DAX
  • Power BI
  • Template Store
    • Ready to Use Templates
  • Courses
  • Academy
    • Excel + AI Mastery: 100 Formulas
    • Excel Pivot Tables & Dashboards
  • About Us
  • Contact Us
Copyright © 2023 PK-AnExcelExpert.com - Privacy Policy