New: NextGenTemplates Academy - video courses on Excel formulas with AI and Pivot Tables & dashboards. Early-bird: 20% off with code EARLYBIRD20 - first 20 orders only. See the courses →
  • Learn Excel (Free Course)
    • 1. Shortcut Keys
    • 2. Fill & Flash Fill
    • 3. Find & Replace
    • 4. Sort & Filter
    • 5. Formulas & Functions
    • 6. Data Validation
    • 7. Conditional Formatting
    • 8. Basic Charts
    • 9. Advanced Charts
    • 10. Pivot Tables
    • 11. Excel Dashboards
    • 12. VBA Course
    • 13. Excel Formulas with AI
  • Templates
  • Tutorials
    • Charts and Visualization
    • VBA
    • Excel Tips and Tricks
    • Excel Dashboards
    • Power Pivot & DAX
  • Power BI
  • Template Store
    • Ready to Use Templates
  • Courses
  • Academy
    • Excel + AI Mastery: 100 Formulas
    • Excel Pivot Tables & Dashboards
  • About Us
  • Contact Us

PK: An Excel Expert

Transforming Data into Decisions

Tag: performance dashboard

Power BI

R&D KPI Dashboard in Power BI

January 17, 2025March 26, 2025 PKComments Off on R&D KPI Dashboard in Power BI
In today’s data-driven world, research and development (R&D) teams need to track and measure key performance indicators (KPIs) effectively. An R&D KPI Dashboard in Power BI can be an essential
Read More
Dashboard

Telecom Network KPI Dashboard in Excel

December 27, 2024April 10, 2025 PKComments Off on Telecom Network KPI Dashboard in Excel
In today's fast-paced telecom industry, maintaining an efficient and high-performing network is critical for service providers. The Telecom Network KPI Dashboard is a powerful tool designed to provide telecom operators
Read More
Power BI

Operations KPI Dashboard in Power BI

December 20, 2024February 24, 2025 PKComments Off on Operations KPI Dashboard in Power BI
In today's business environment, managing and monitoring operational performance is crucial for achieving organizational goals. One of the most effective ways to track and analyze key performance indicators (KPIs) is
Read More
Power BI

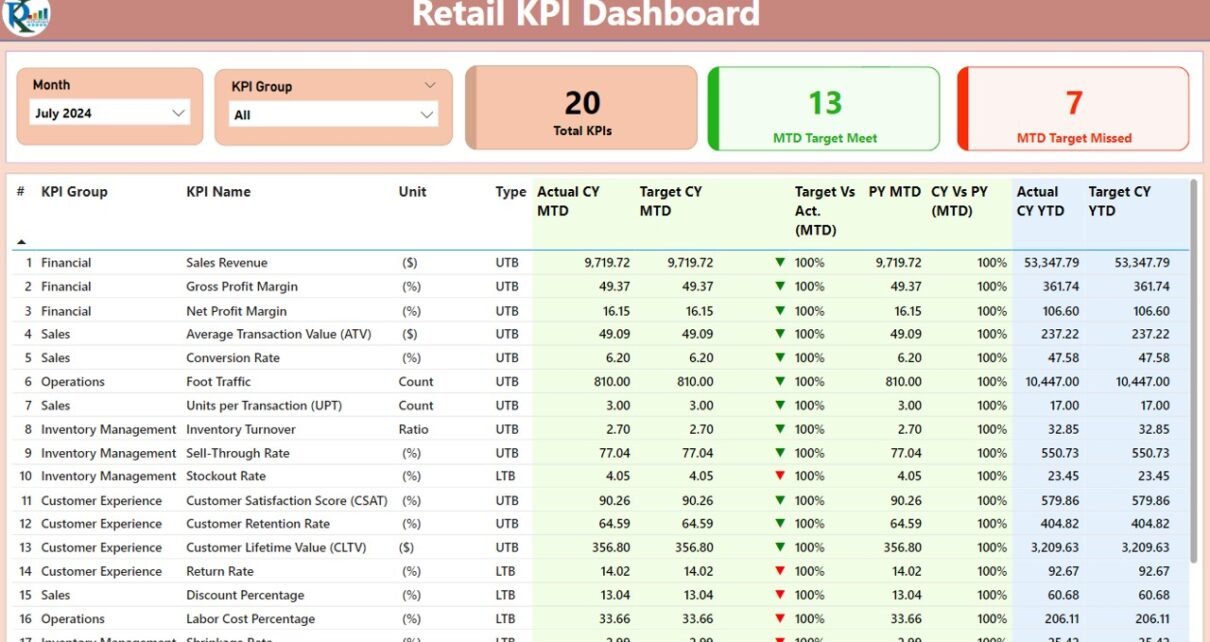
Retail KPI Dashboard in Power BI

December 12, 2024March 6, 2025 PKComments Off on Retail KPI Dashboard in Power BI
In this article, we will explore the Retail KPI Dashboard in Power BI, its key features, how it works, and how you can use it to drive better performance in
Read More
Dashboard

Textile Industry KPI Dashboard in Excel

November 7, 2024February 25, 2025 PKComments Off on Textile Industry KPI Dashboard in Excel
In the fast-paced and competitive textile industry, monitoring performance is essential for sustaining growth and achieving goals. A well-structured Textile Industry KPI Dashboard in Excel provides a clear view of
Read More
Dashboard

Customer Service KPI Dashboard in Excel

October 19, 2024March 12, 2025 PKComments Off on Customer Service KPI Dashboard in Excel
Customer service plays a vital role in the success of any business. Whether you’re a startup or a well-established organization, keeping track of how well your customer service team is
Read More

Posts pagination

Previous 1 … 8 9
  • Learn Excel (Free Course)
    • 1. Shortcut Keys
    • 2. Fill & Flash Fill
    • 3. Find & Replace
    • 4. Sort & Filter
    • 5. Formulas & Functions
    • 6. Data Validation
    • 7. Conditional Formatting
    • 8. Basic Charts
    • 9. Advanced Charts
    • 10. Pivot Tables
    • 11. Excel Dashboards
    • 12. VBA Course
    • 13. Excel Formulas with AI
  • Templates
  • Tutorials
    • Charts and Visualization
    • VBA
    • Excel Tips and Tricks
    • Excel Dashboards
    • Power Pivot & DAX
  • Power BI
  • Template Store
    • Ready to Use Templates
  • Courses
  • Academy
    • Excel + AI Mastery: 100 Formulas
    • Excel Pivot Tables & Dashboards
  • About Us
  • Contact Us
Copyright © 2023 PK-AnExcelExpert.com - Privacy Policy