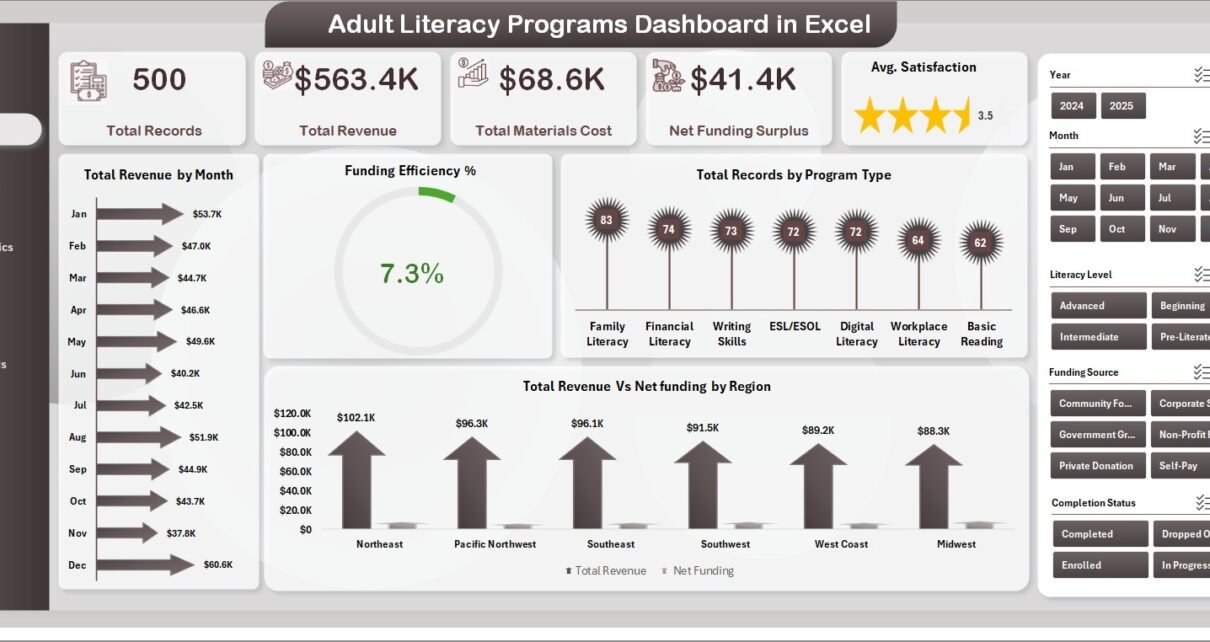
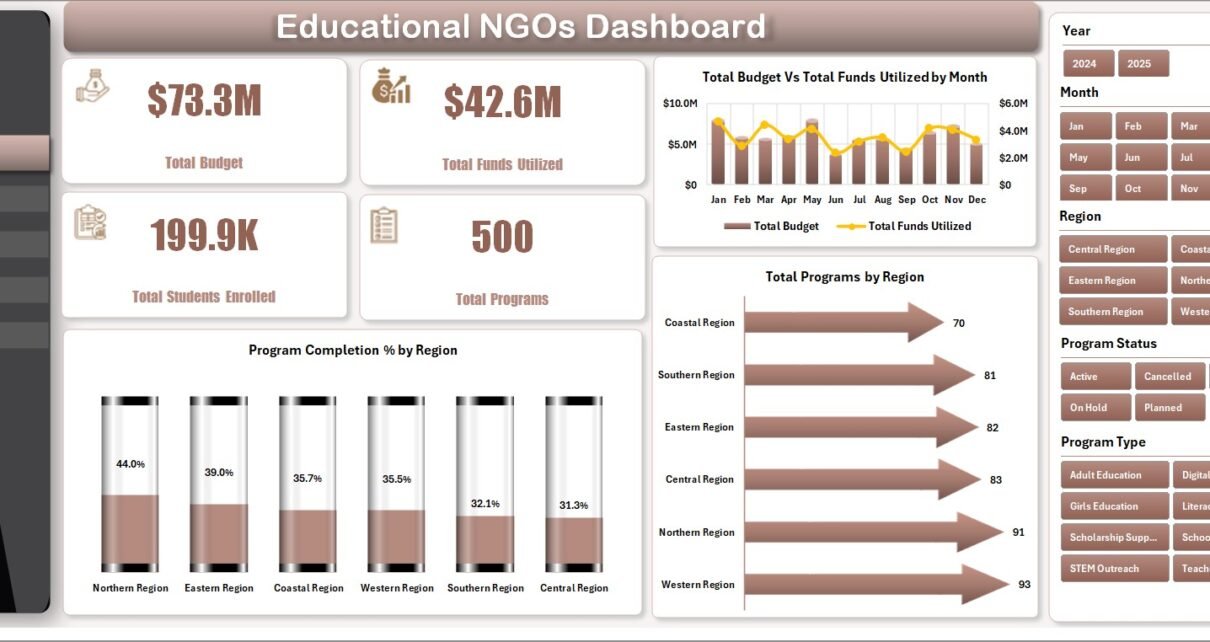
PKComments Off on Quick Dynamic Sales by Employees chart with Slicer in Excel
Excel is a powerful tool which can be used for a wide range of business applications, for analyzing data, creating charts and graphs etc. One useful feature in Excel is
PKComments Off on One Pager KPI dashboard in Excel
Excel is a widely used tool for businesses and individuals for data analysis, tracking, and visualization. Excel Dashboard is an effective way to present complex data in a simplified manner,
PKComments Off on 4 Ultimate Tips for Data Separation and Conversion using Text to column
Excel is a veritable powerhouse when it comes to managing and analyzing data. Regardless of whether you are dealing with massive datasets or tiny lists, Excel offers an array of
The Excel formulas are absolute lifesavers when it comes to dealing with data in spreadsheets. They're like the Swiss Army knives of Excel, allowing you to calculate, manipulate, and automate
In this article, we have created beautiful 3D Gauge Chart. We have used Excel shapes and Pie Chart to create this beautiful visualization. You can use this chart in your
PKComments Off on Fully dynamic chart in Excel with Scroll bar and Spin button
Are you ready to unleash the full potential of Excel's data analysis and visualization capabilities? Hold on tight, because we're diving into the mysterious realm of creating a fully dynamic
PKComments Off on Dynamic Chart with Slicer for Employees Count by Age group
Data analysis is an essential aspect of any business. It helps to make informed decisions based on evidence and trends. One of the ways to present data is through charts,