In today’s fast-paced business environment, visual data representation has become an indispensable tool for decision-making and performance analysis. One effective way to visually represent your data is through dynamic charts. In this blog post, we will explain you step by step, how to create a dynamic chart for top selected employees using Excel’s GROUPBY and TAKE functions. We will also explain you how to connect this with form control spin button. This method is not only engaging but also incredibly insightful for tracking employee performance over time.
Introduction to Dynamic Chart
Dynamic charts are interactive charts which will update automatically when you change the value of spin button. We have created the several example of dynamic charts on our YouTube channel and out website.
Below are the steps to create the dynamic chart for top selected employees-
Step 1: Preparing Your Data
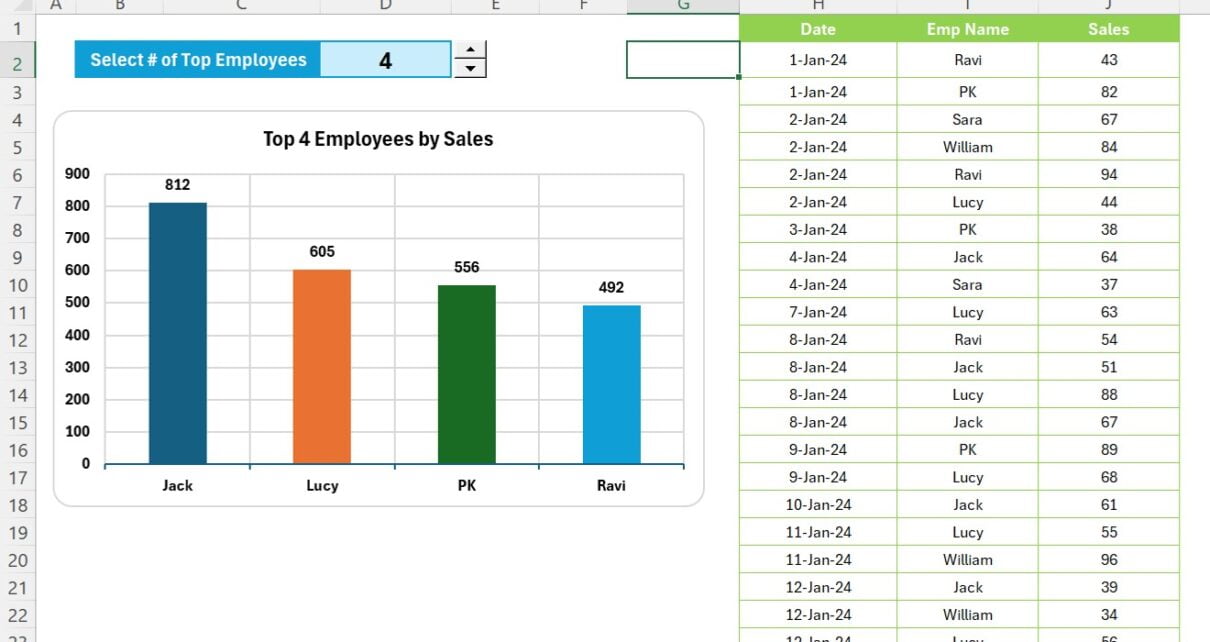
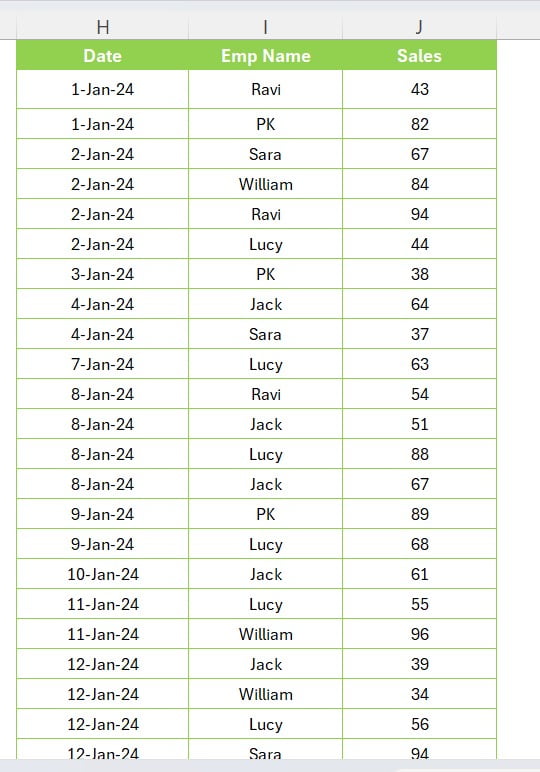
Before diving into the chart creation, ensure you have your data organized in a table named “Data” containing columns for Date, Emp Name, and Sales. This structure will serve as the foundation for our dynamic chart.
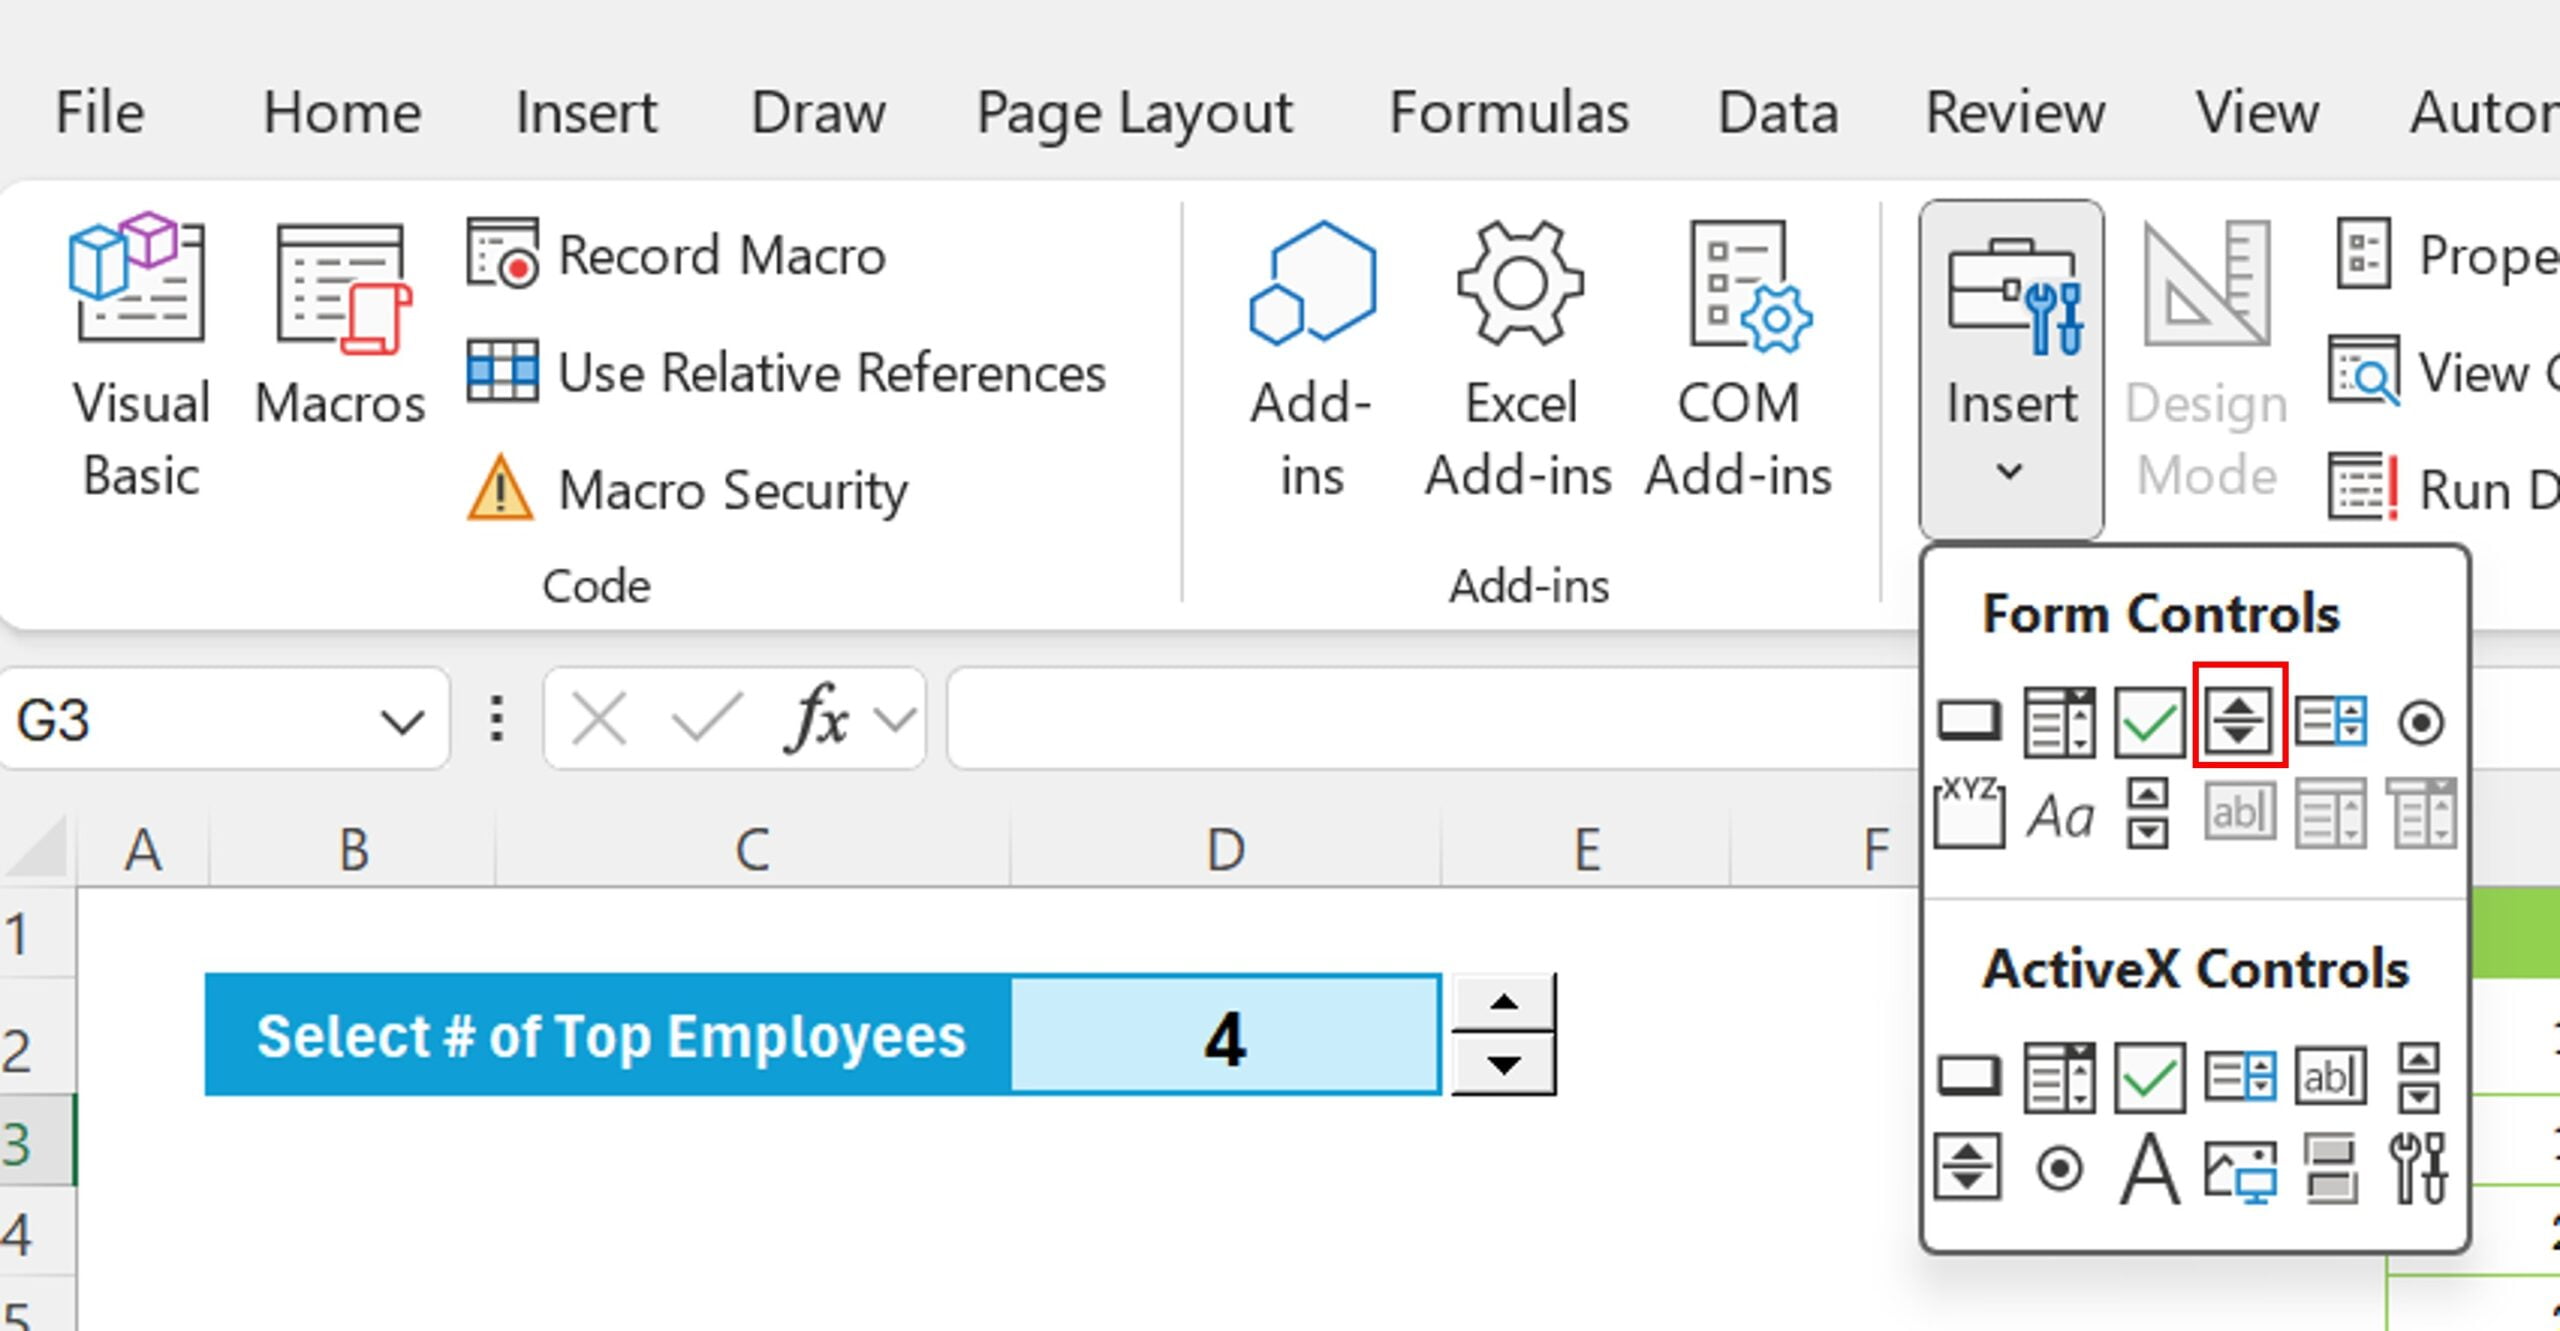
Step 2: Inserting a Form Control Spin Button
A form control spin button will allow users to adjust the number of top employees displayed in the chart dynamically. Here’s how to insert one:
- Navigate to the Developer tab, click on Insert, and then select Form controls > Spin button.
- Right-click on the inserted spin button and choose Format Control.
- In the settings, set the Minimum value to 2 and the Maximum value to 7 (assuming we have 7 unique employees in our data).
- Enter $D$3 in the Cell Link box to link the spin button to cell D3.
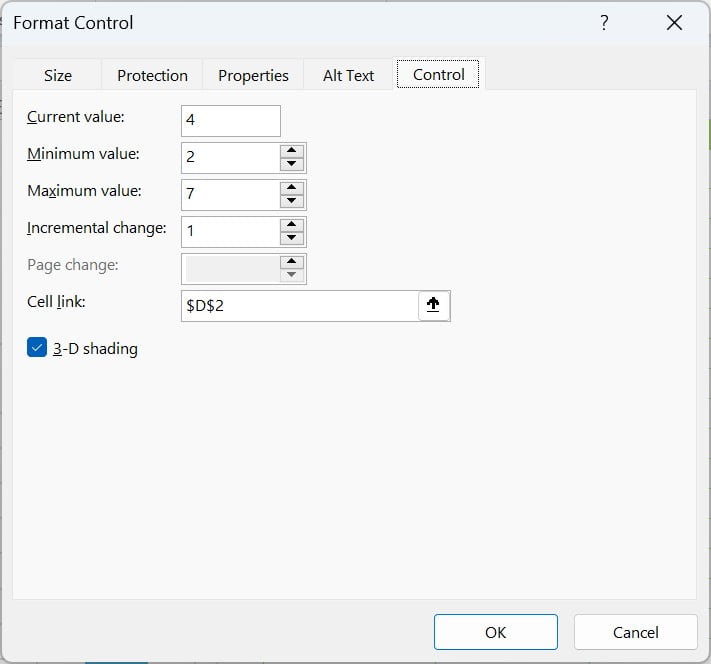
- Click OK to finish.
Now, the spin button is linked with cell E3, and clicking on it will change the value between 2 and 7, reflecting the number of top employees you wish to display.
Step 3: Crafting the Formula
To fetch the top selected employees by total sales, input the following formula in range N1:
=TAKE(GROUPBY(Data[Emp Name], Data[Sales], SUM,, 0, -2), E3)
This formula uses the GROUPBY function to aggregate sales by employee, and the TAKE function to select the top performers based on the number set by the spin button.
Step 4: Inserting the Chart
After applying the formula, you’ll have the data for the top selected employees. Next:
- Select the output range of the formula.
- Go to the Insert tab and choose a 2D column chart.
- Add data labels for clarity.
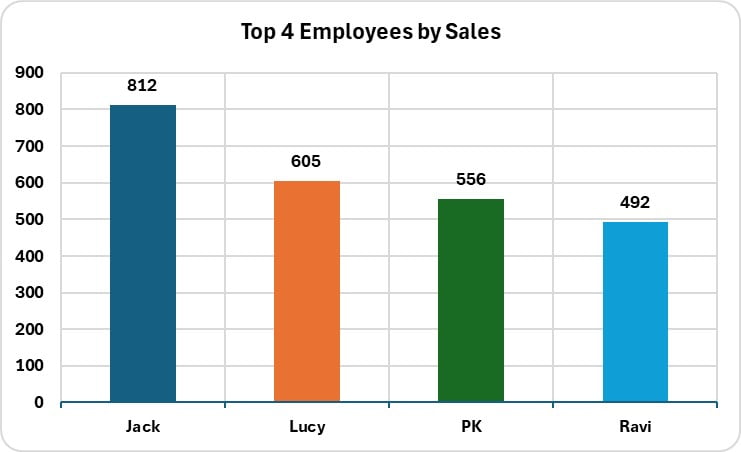
Step 5: Making the Chart Title Dynamic
To make your chart even more interactive, you can dynamically update its title based on the spin button’s selection. Place the following formula in range F1:
="Top "&D3&" Employees by Sales"
Then, link the chart title to this cell by selecting the chart title, going to the formula bar, pressing “=”, and clicking on F1. The chart title will now update automatically to reflect the number of top employees shown.
Conclusion
Congratulations! Your dynamic chart for the top selected employees is now ready. You can use this in your business dashboard or in Employee Performance Report. You can change the maximum number of the employees which you want to which want to show on the change in the Spin button format control part. Engaging with your data has never been easier or more intuitive.
Visit our YouTube channel to learn step-by-step video tutorials