New: NextGenTemplates Academy - video courses on Excel formulas with AI and Pivot Tables & dashboards. Early-bird: 20% off with code EARLYBIRD20 - first 20 orders only. See the courses →
  • Learn Excel (Free Course)
    • 1. Shortcut Keys
    • 2. Fill & Flash Fill
    • 3. Find & Replace
    • 4. Sort & Filter
    • 5. Formulas & Functions
    • 6. Data Validation
    • 7. Conditional Formatting
    • 8. Basic Charts
    • 9. Advanced Charts
    • 10. Pivot Tables
    • 11. Excel Dashboards
    • 12. VBA Course
    • 13. Excel Formulas with AI
  • Templates
  • Tutorials
    • Charts and Visualization
    • VBA
    • Excel Tips and Tricks
    • Excel Dashboards
    • Power Pivot & DAX
  • Power BI
  • Template Store
    • Ready to Use Templates
  • Courses
  • Academy
    • Excel + AI Mastery: 100 Formulas
    • Excel Pivot Tables & Dashboards
  • About Us
  • Contact Us

PK: An Excel Expert

Transforming Data into Decisions

Tag: dynamic charts

Power BI

Fashion KPI Dashboard in Power BI

January 28, 2025April 6, 2025 PKComments Off on Fashion KPI Dashboard in Power BI
Fashion is an ever-evolving industry where data-driven decisions are essential to maintain efficiency and profitability. One powerful way to stay ahead in the game is by using a Fashion KPI
Read More
Top Employees Dynamic Chart by GROUPBY and TAKE
Charts and Visualization

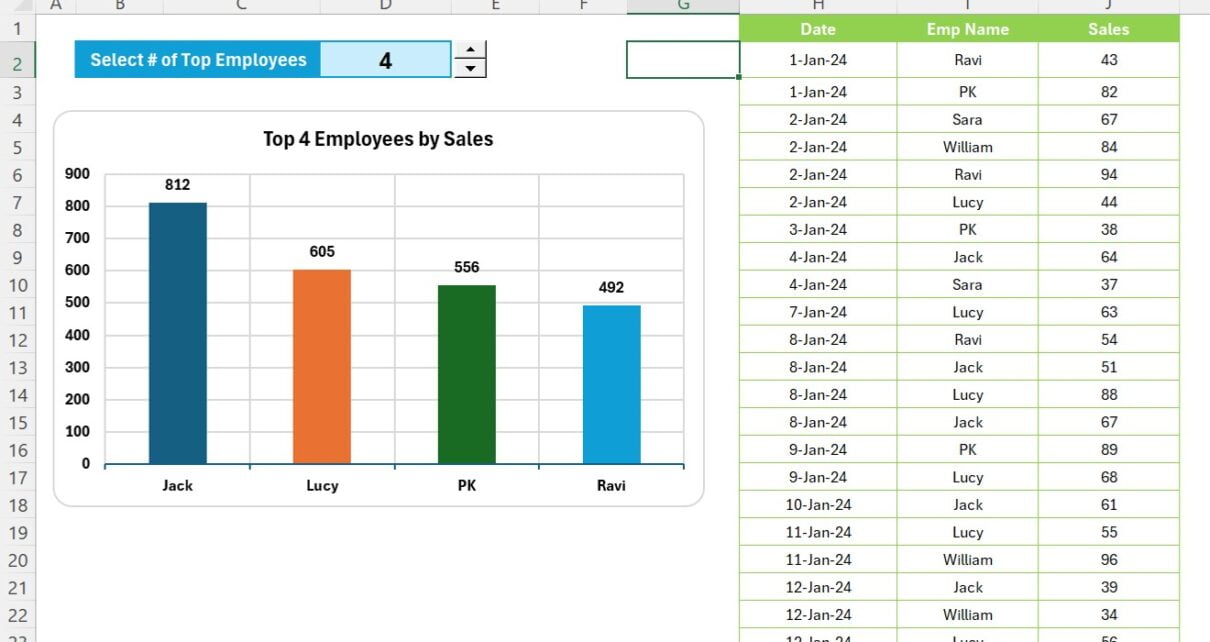
Dynamic chart for Top Selected Employees with GROUPBY and TAKE function

February 4, 2024October 10, 2026 PKComments Off on Dynamic chart for Top Selected Employees with GROUPBY and TAKE function
In today's fast-paced business environment, visual data representation has become an indispensable tool for decision-making and performance analysis. One effective way to visually represent your data is through dynamic charts.
Read More
Candle Infographic Chart in Excel: Step-by-Step Tutorial
Charts and Visualization

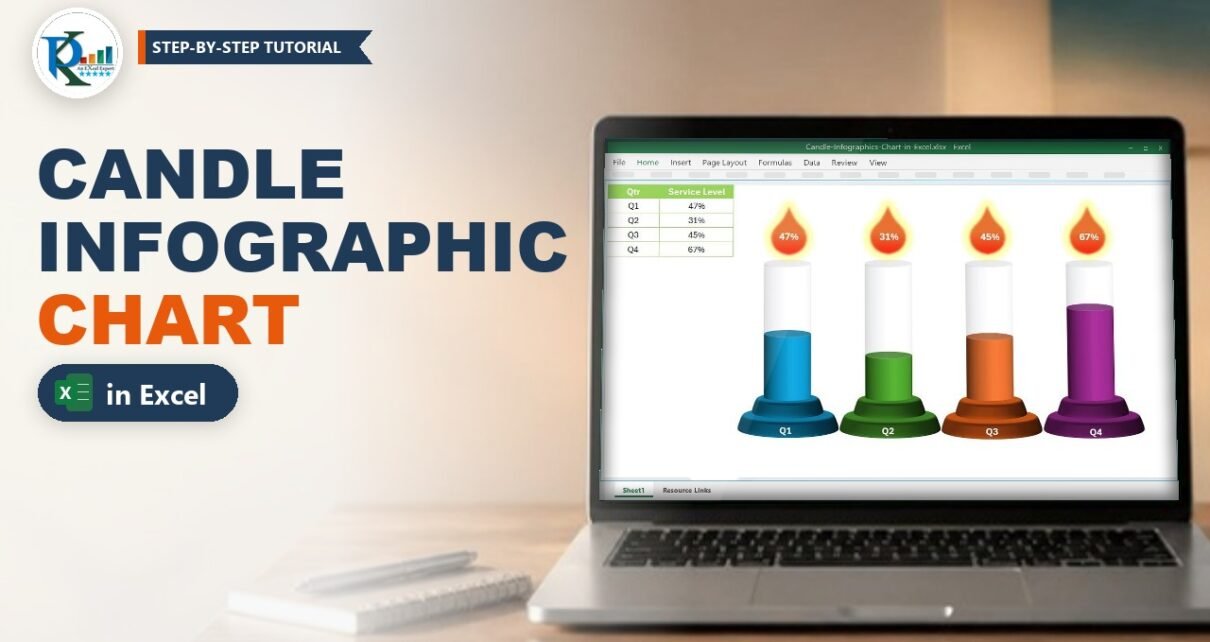
Candle Infographic Chart in Excel: Step-by-Step Tutorial

December 26, 2023October 9, 2026 PKComments Off on Candle Infographic Chart in Excel: Step-by-Step Tutorial
A candle infographic chart in Excel turns four plain percentages into four glowing candles: the coloured wax shows the value, the flame on top shows the number, and the whole
Read More
Quick Dynamic Sales by Employees chart with Slicers
Charts and Visualization

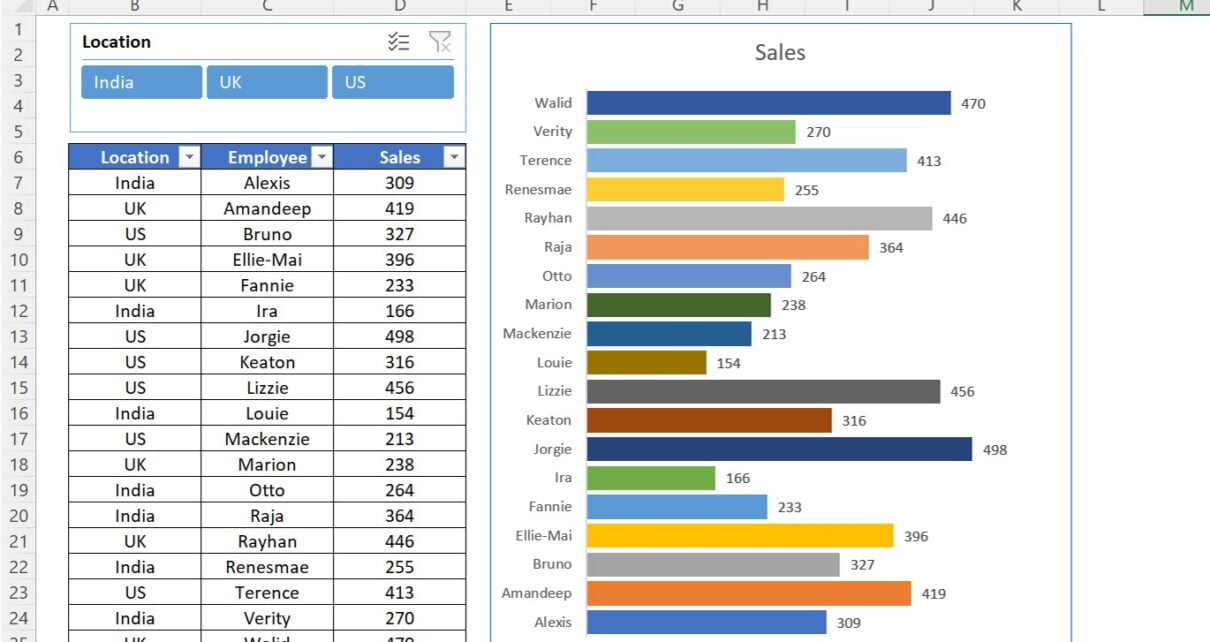
Quick Dynamic Sales by Employees chart with Slicer in Excel

March 16, 2023March 2, 2025 PKComments Off on Quick Dynamic Sales by Employees chart with Slicer in Excel
Excel is a powerful tool which can be used for a wide range of business applications, for analyzing data, creating charts and graphs etc. One useful feature in Excel is
Read More
  • Learn Excel (Free Course)
    • 1. Shortcut Keys
    • 2. Fill & Flash Fill
    • 3. Find & Replace
    • 4. Sort & Filter
    • 5. Formulas & Functions
    • 6. Data Validation
    • 7. Conditional Formatting
    • 8. Basic Charts
    • 9. Advanced Charts
    • 10. Pivot Tables
    • 11. Excel Dashboards
    • 12. VBA Course
    • 13. Excel Formulas with AI
  • Templates
  • Tutorials
    • Charts and Visualization
    • VBA
    • Excel Tips and Tricks
    • Excel Dashboards
    • Power Pivot & DAX
  • Power BI
  • Template Store
    • Ready to Use Templates
  • Courses
  • Academy
    • Excel + AI Mastery: 100 Formulas
    • Excel Pivot Tables & Dashboards
  • About Us
  • Contact Us
Copyright © 2023 PK-AnExcelExpert.com - Privacy Policy