New: NextGenTemplates Academy - video courses on Excel formulas with AI and Pivot Tables & dashboards. Early-bird: 20% off with code EARLYBIRD20 - first 20 orders only. See the courses →
  • Learn Excel (Free Course)
    • 1. Shortcut Keys
    • 2. Fill & Flash Fill
    • 3. Find & Replace
    • 4. Sort & Filter
    • 5. Formulas & Functions
    • 6. Data Validation
    • 7. Conditional Formatting
    • 8. Basic Charts
    • 9. Advanced Charts
    • 10. Pivot Tables
    • 11. Excel Dashboards
    • 12. VBA Course
    • 13. Excel Formulas with AI
  • Templates
  • Tutorials
    • Charts and Visualization
    • VBA
    • Excel Tips and Tricks
    • Excel Dashboards
    • Power Pivot & DAX
  • Power BI
  • Template Store
    • Ready to Use Templates
  • Courses
  • Academy
    • Excel + AI Mastery: 100 Formulas
    • Excel Pivot Tables & Dashboards
  • About Us
  • Contact Us

PK: An Excel Expert

Transforming Data into Decisions

Tag: operational efficiency

Dashboard Power BI

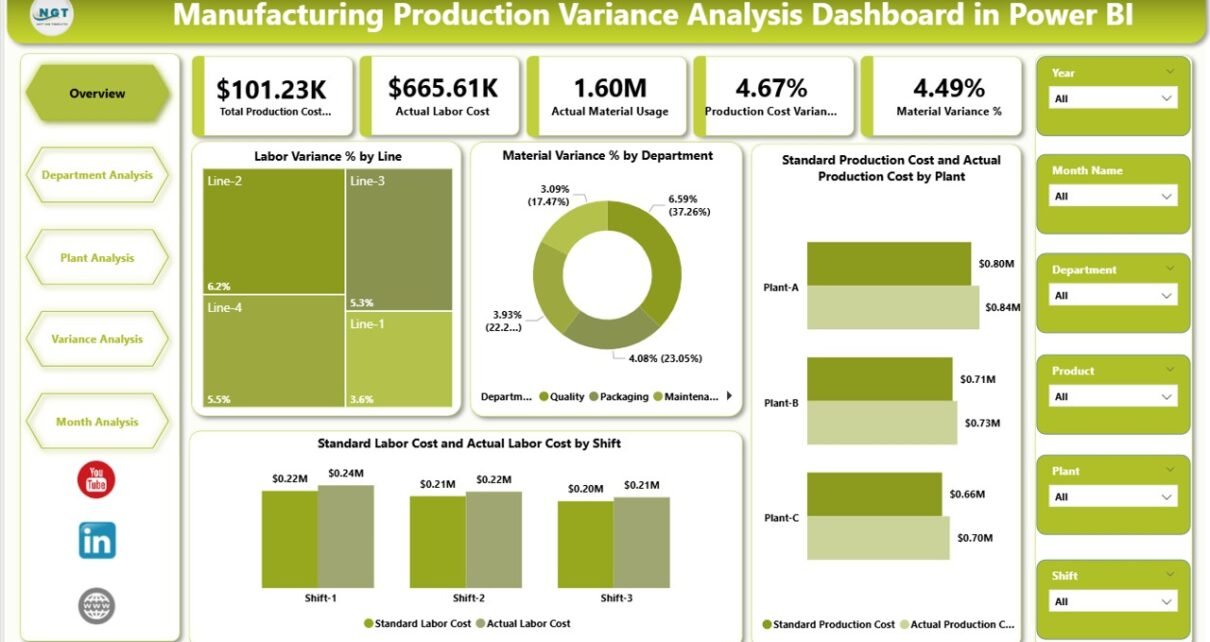
Manufacturing Production Variance Analysis Dashboard in Power BI

December 12, 2025December 12, 2025 PKComments Off on Manufacturing Production Variance Analysis Dashboard in Power BI
Manufacturing companies operate in a highly competitive environment where small cost deviations can lead to big financial impacts. Therefore, leaders must track production performance continuously, compare actual results with standards,
Read More
Dashboard

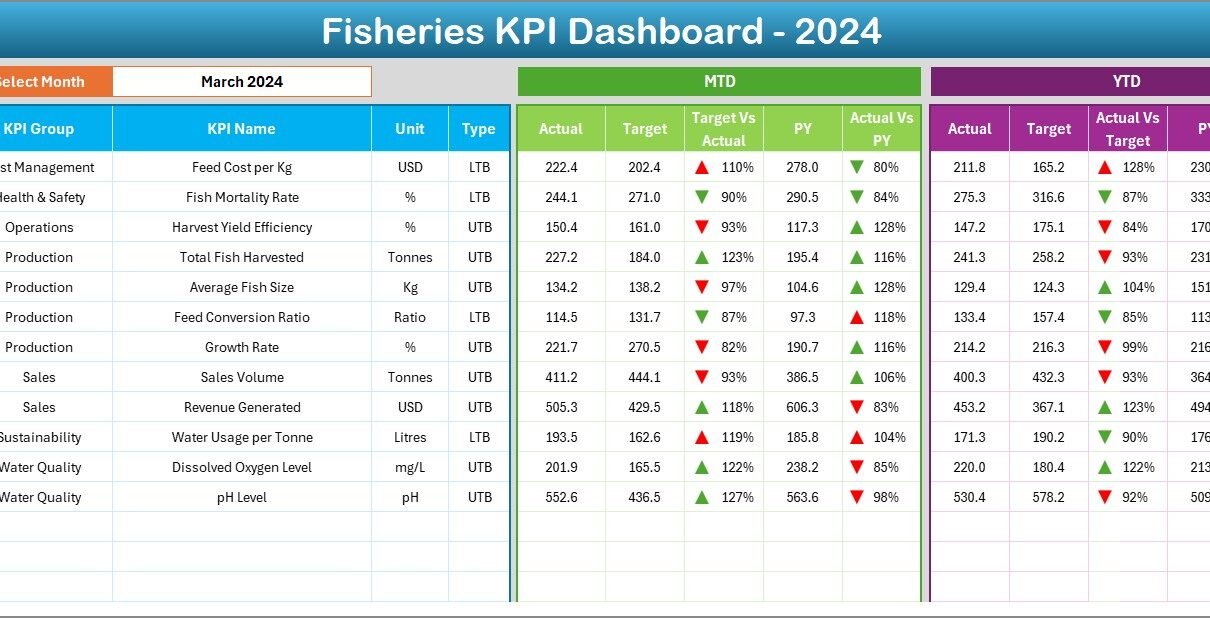
Fisheries KPI Dashboard in Excel

October 29, 2025October 29, 2025 PKComments Off on Fisheries KPI Dashboard in Excel
The global fisheries industry is a vital source of food, income, and economic growth. However, managing operations efficiently—from catch volumes to resource utilization—requires reliable data insights. That’s why an Excel-based
Read More
Dashboard Power BI

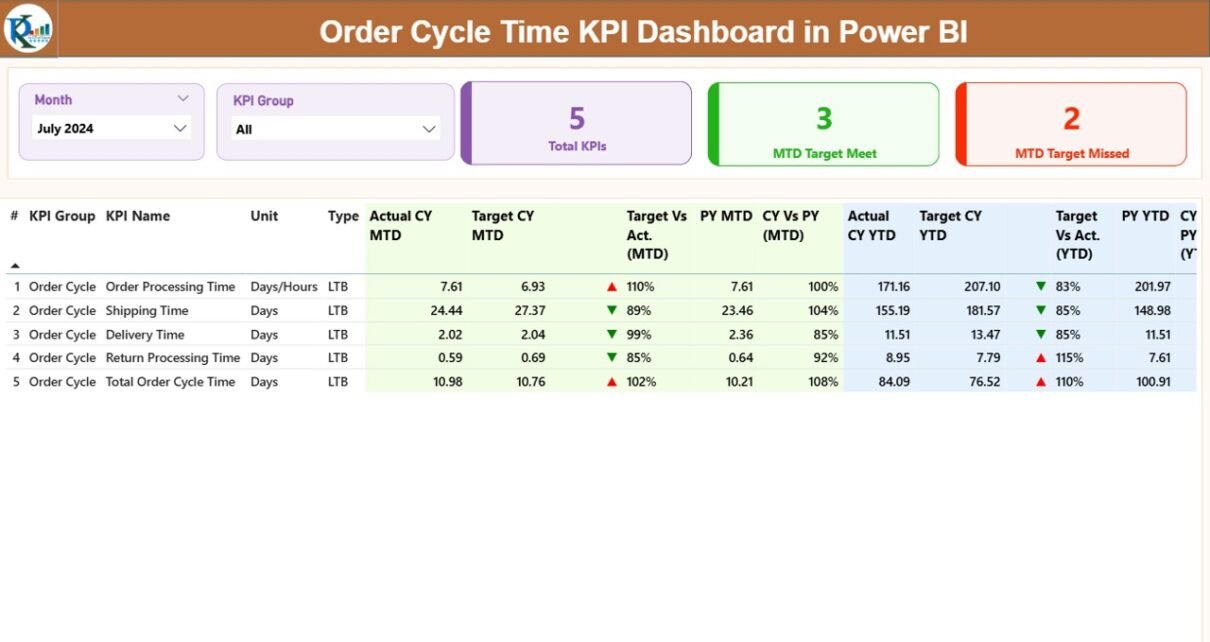
Order Cycle Time KPI Dashboard in Power BI

October 14, 2025October 14, 2025 PKComments Off on Order Cycle Time KPI Dashboard in Power BI
In today’s competitive business world, speed and efficiency are key drivers of customer satisfaction and profitability. One of the most critical performance metrics in supply chain and logistics operations is
Read More
Templates

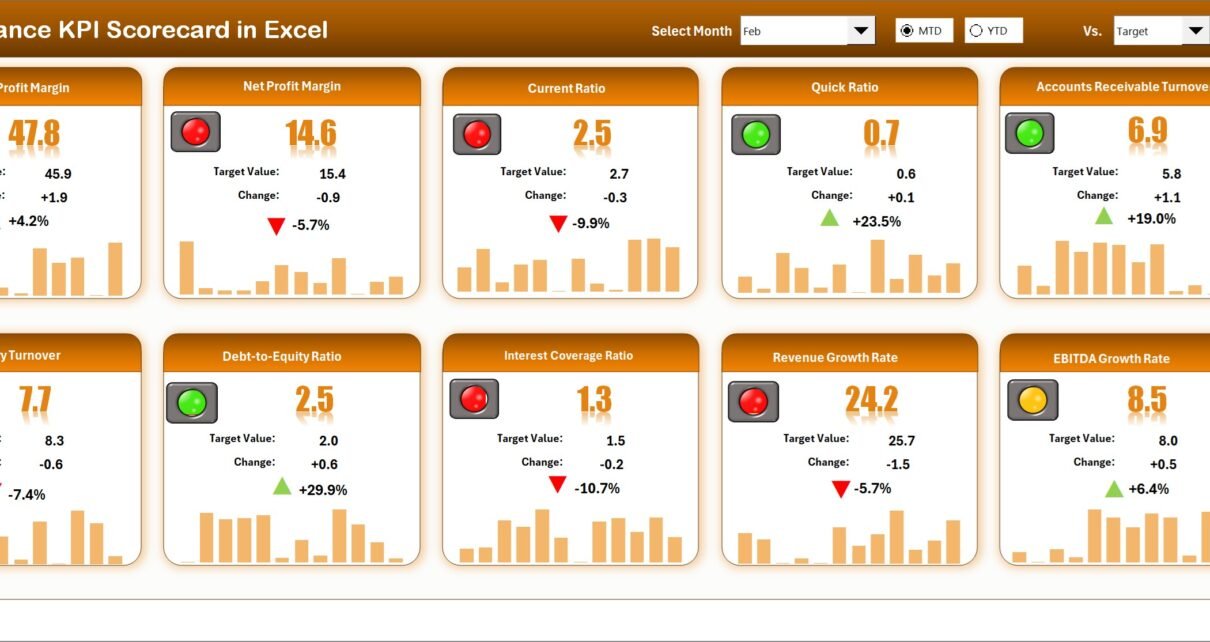
Finance KPI Scorecard in Excel

September 28, 2025September 28, 2025 PKComments Off on Finance KPI Scorecard in Excel
Effective financial management is essential for the success of any organization. A Finance KPI Scorecard in Excel allows finance teams and executives to track key financial metrics, identify trends, and
Read More
Dashboard

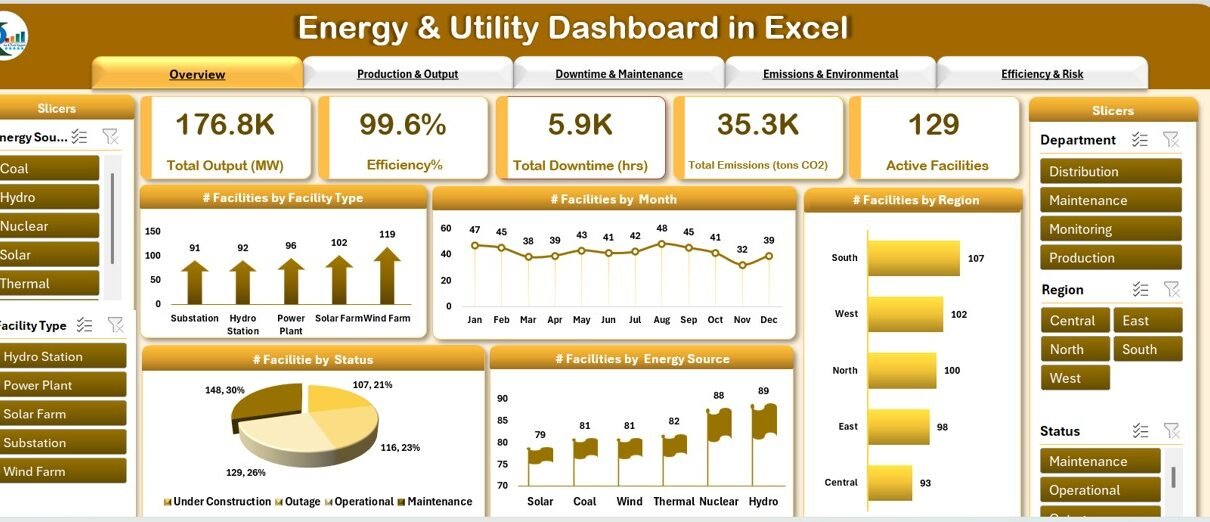
Energy & Utility Dashboard in Excel

May 23, 2025May 23, 2025 PKComments Off on Energy & Utility Dashboard in Excel
In today's fast-paced energy and utility sectors, managing operational data efficiently can significantly impact the overall performance of facilities. An Energy & Utility Dashboard in Excel is a powerful tool
Read More
Dashboard

Operational Efficiency KPI Dashboard in Excel

April 21, 2025April 21, 2025 PKComments Off on Operational Efficiency KPI Dashboard in Excel
Operational efficiency is the backbone of any successful business. Organizations constantly strive to optimize their operations, reduce waste, and enhance productivity. Key Performance Indicators (KPIs) are essential tools for measuring
Read More
Power BI

Broadcasting KPI Dashboard in Power BI

January 28, 2025April 8, 2025 PKComments Off on Broadcasting KPI Dashboard in Power BI
In today’s data-driven world, tracking Key Performance Indicators (KPIs) is crucial for broadcasting companies. KPIs provide insights into operational efficiency, audience engagement, and overall success. To streamline KPI tracking, Power
Read More
Dashboard

Factory Automation KPI Dashboard in Excel

January 23, 2025October 10, 2026 PKComments Off on Factory Automation KPI Dashboard in Excel
In the fast-evolving world of manufacturing, factory automation is a critical factor in achieving operational efficiency, reducing costs, and enhancing product quality. Factory automation integrates various control systems, machinery, processes,
Read More
Dashboard

Autonomous Vehicle KPI Dashboard in Excel

January 23, 2025October 10, 2026 PKComments Off on Autonomous Vehicle KPI Dashboard in Excel
The rise of autonomous vehicles (AVs) marks a significant advancement in the transportation industry, with the promise of safer, more efficient, and cost-effective travel. However, as autonomous vehicle technology evolves,
Read More
Dashboard

Field Service KPI Dashboard in Excel

January 23, 2025March 20, 2025 PKComments Off on Field Service KPI Dashboard in Excel
Introduction In the dynamic realm of field services, achieving operational excellence is crucial. The Field Service KPI Dashboard in Excel is an indispensable tool designed to empower managers and teams
Read More

Posts pagination

1 2 … 4 Next
  • Learn Excel (Free Course)
    • 1. Shortcut Keys
    • 2. Fill & Flash Fill
    • 3. Find & Replace
    • 4. Sort & Filter
    • 5. Formulas & Functions
    • 6. Data Validation
    • 7. Conditional Formatting
    • 8. Basic Charts
    • 9. Advanced Charts
    • 10. Pivot Tables
    • 11. Excel Dashboards
    • 12. VBA Course
    • 13. Excel Formulas with AI
  • Templates
  • Tutorials
    • Charts and Visualization
    • VBA
    • Excel Tips and Tricks
    • Excel Dashboards
    • Power Pivot & DAX
  • Power BI
  • Template Store
    • Ready to Use Templates
  • Courses
  • Academy
    • Excel + AI Mastery: 100 Formulas
    • Excel Pivot Tables & Dashboards
  • About Us
  • Contact Us
Copyright © 2023 PK-AnExcelExpert.com - Privacy Policy