New: NextGenTemplates Academy - video courses on Excel formulas with AI and Pivot Tables & dashboards. Early-bird: 20% off with code EARLYBIRD20 - first 20 orders only. See the courses →
  • Learn Excel (Free Course)
    • 1. Shortcut Keys
    • 2. Fill & Flash Fill
    • 3. Find & Replace
    • 4. Sort & Filter
    • 5. Formulas & Functions
    • 6. Data Validation
    • 7. Conditional Formatting
    • 8. Basic Charts
    • 9. Advanced Charts
    • 10. Pivot Tables
    • 11. Excel Dashboards
    • 12. VBA Course
    • 13. Excel Formulas with AI
  • Templates
  • Tutorials
    • Charts and Visualization
    • VBA
    • Excel Tips and Tricks
    • Excel Dashboards
    • Power Pivot & DAX
  • Power BI
  • Template Store
    • Ready to Use Templates
  • Courses
  • Academy
    • Excel + AI Mastery: 100 Formulas
    • Excel Pivot Tables & Dashboards
  • About Us
  • Contact Us

PK: An Excel Expert

Transforming Data into Decisions

Power Point Visualization

This category provides a comprehensive set of tutorials to help you create dynamic and engaging presentations in PowerPoint. From creating effective slides to adding charts, graphs, and multimedia, our tutorials will guide you through the process of building impactful presentations. Each tutorial comes with a free practice file for download and tutorial videos to help you follow along easily. Start your PowerPoint Visualization tutorial now and learn how to create professional and polished presentations that will impress your audience. Take your presentation skills to the next level by exploring this category today.

Gantt Chart in PPT
Power Point Visualization

Data-Driven Gantt Chart in PowerPoint with Conditional Formatting

September 7, 2022February 18, 2025 PKComments Off on Data-Driven Gantt Chart in PowerPoint with Conditional Formatting
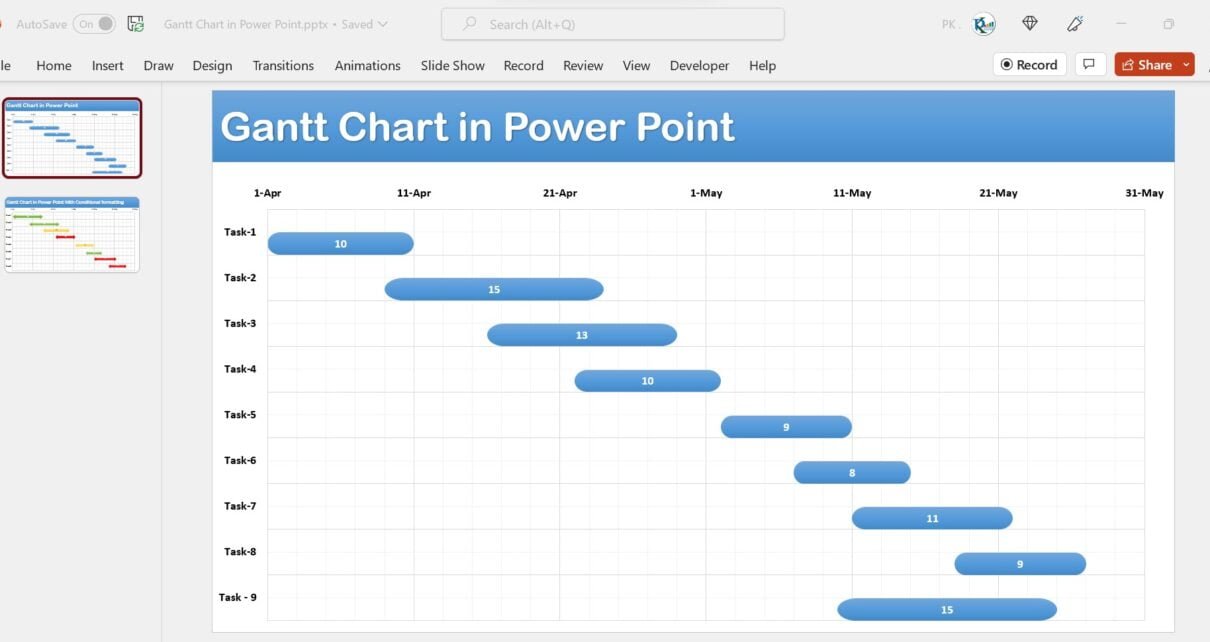
In this article, we have created a Data-Driven Gantt Chart  in PowerPoint with Conditional Formatting and Animation. You can use it in your Project Management slides. Click to buy Data-Driven
Read More
Animated Filled Spheres in PowerPoint (Free Template)
Power Point Visualization

Animated Filled Spheres in PowerPoint (Free Template)

September 23, 2019October 9, 2026 PKComments Off on Animated Filled Spheres in PowerPoint (Free Template)
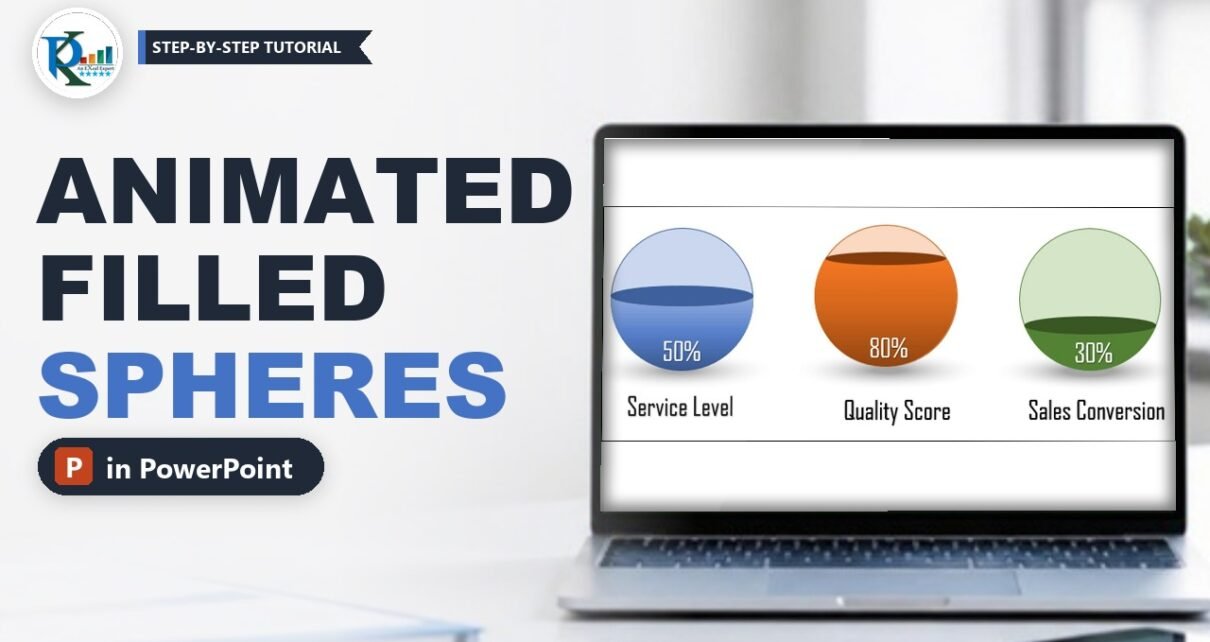
Animated filled spheres in PowerPoint turn plain KPI percentages into glass balls that fill up, one click at a time, while you present. Each sphere shows a metric such as
Read More
Data Driven 3D Battery Chart in PowerPoint (Free Template)
Power Point Visualization

Data Driven 3D Battery Chart in PowerPoint (Free Template)

September 19, 2019October 9, 2026 PKComments Off on Data Driven 3D Battery Chart in PowerPoint (Free Template)
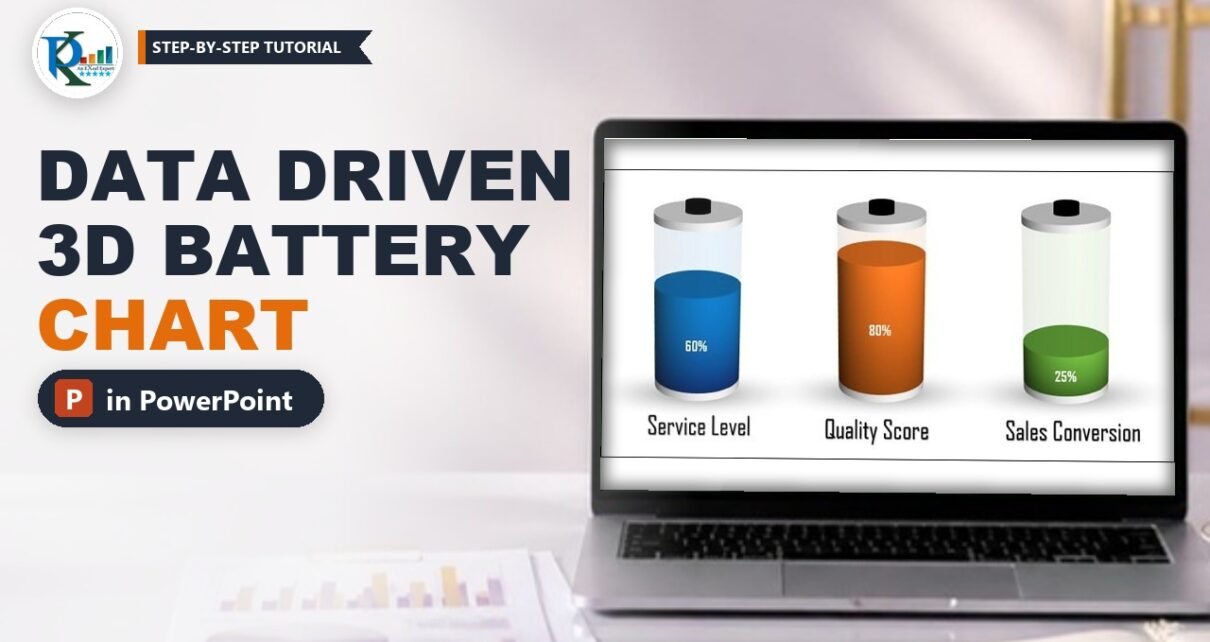
A data driven 3D battery chart in PowerPoint shows a percentage as the charge level of a glass battery, so anyone in the room can read a KPI at a
Read More
Animated Target vs Actual Sales Chart in PowerPoint (Free PPTX)
Power Point Visualization

Animated Target vs Actual Sales Chart in PowerPoint (Free PPTX)

September 12, 2019October 9, 2026 PKComments Off on Animated Target vs Actual Sales Chart in PowerPoint (Free PPTX)
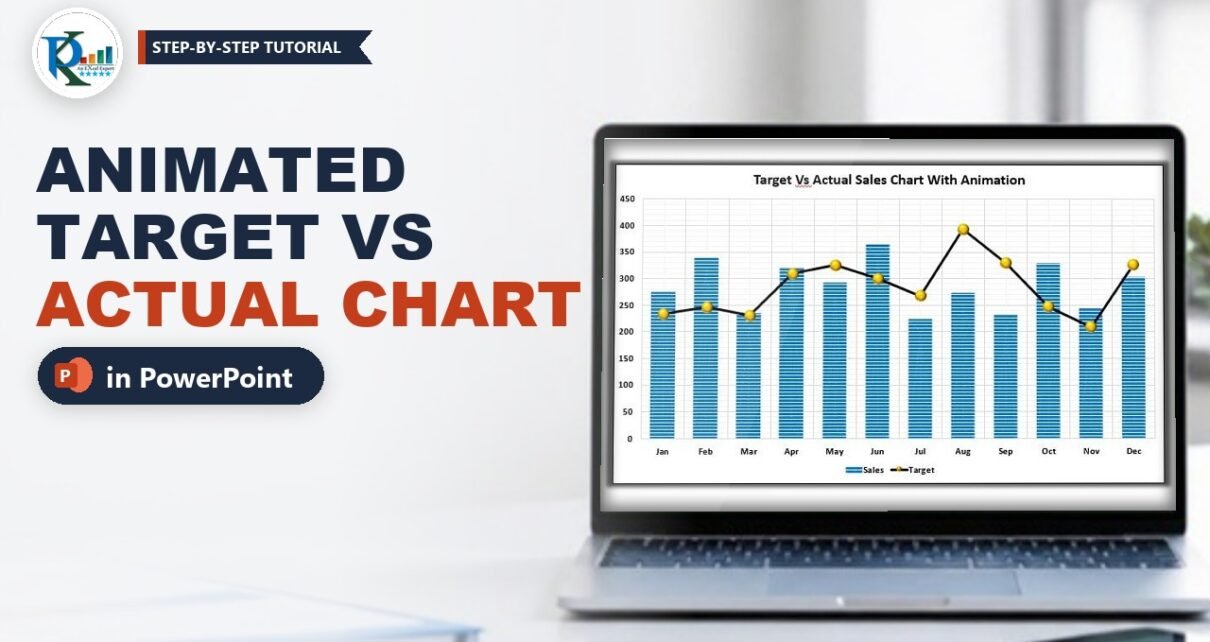
An animated target vs actual sales chart in PowerPoint lets you reveal your results one step at a time in a business review: first the empty chart, then the actual
Read More
  • Learn Excel (Free Course)
    • 1. Shortcut Keys
    • 2. Fill & Flash Fill
    • 3. Find & Replace
    • 4. Sort & Filter
    • 5. Formulas & Functions
    • 6. Data Validation
    • 7. Conditional Formatting
    • 8. Basic Charts
    • 9. Advanced Charts
    • 10. Pivot Tables
    • 11. Excel Dashboards
    • 12. VBA Course
    • 13. Excel Formulas with AI
  • Templates
  • Tutorials
    • Charts and Visualization
    • VBA
    • Excel Tips and Tricks
    • Excel Dashboards
    • Power Pivot & DAX
  • Power BI
  • Template Store
    • Ready to Use Templates
  • Courses
  • Academy
    • Excel + AI Mastery: 100 Formulas
    • Excel Pivot Tables & Dashboards
  • About Us
  • Contact Us
Copyright © 2023 PK-AnExcelExpert.com - Privacy Policy