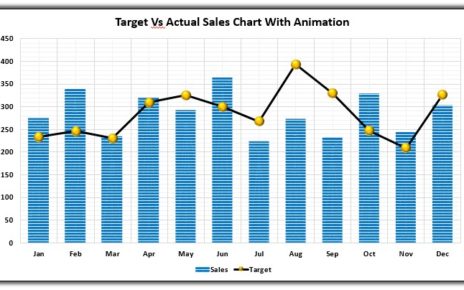
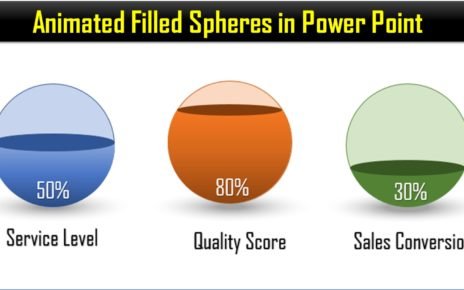
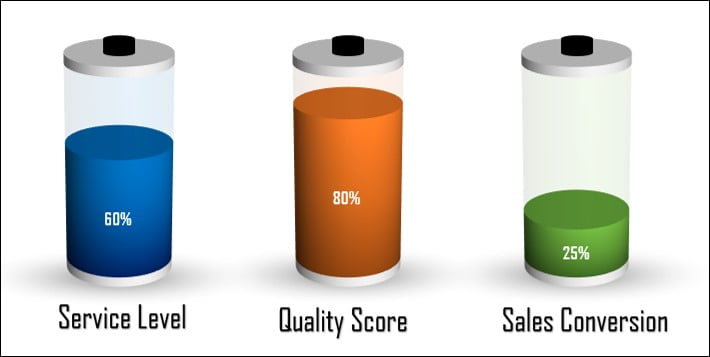
In this article, we have created Data driven 3D Battery Chart in Power Point slide. Right click on the chart and click on Edit Data to change the data. You can use this template for your business review to display the business/process Performance.

Data Driven 3D Battery Chart in Power Point Presentation
19
Sep 2019
6723Comments Off on Data Driven 3D Battery Chart in Power Point Presentation
PK
Meet PK, the founder of PK-AnExcelExpert.com! With over 15 years of experience in Data Visualization, Excel Automation, and dashboard creation. PK is a Microsoft Certified Professional who has a passion for all things in Excel. PK loves to explore new and innovative ways to use Excel and is always eager to share his knowledge with others. With an eye for detail and a commitment to excellence, PK has become a go-to expert in the world of Excel. Whether you're looking to create stunning visualizations or streamline your workflow with automation, PK has the skills and expertise to help you succeed. Join the many satisfied clients who have benefited from PK's services and see how he can take your Excel skills to the next level!
https://www.pk-anexcelexpert.com
Related Articles
Animated Target Vs Actual Sales Chart in Power Point
We have started the Microsoft Power Point Charts and visualization tutorial. Here we have created a data driven Target Vs
Data-Driven Gantt Chart in PowerPoint with Conditional Formatting
In this article, we have created a Data-Driven Gantt Chart (Project Plan Chart) in PowerPoint with Conditional Formatting and Animation.
Animated Filled Spheres in Power Point
In this article, we have created a beautiful Power Point visualization “Animated Filled Spheres”. You can use this template for