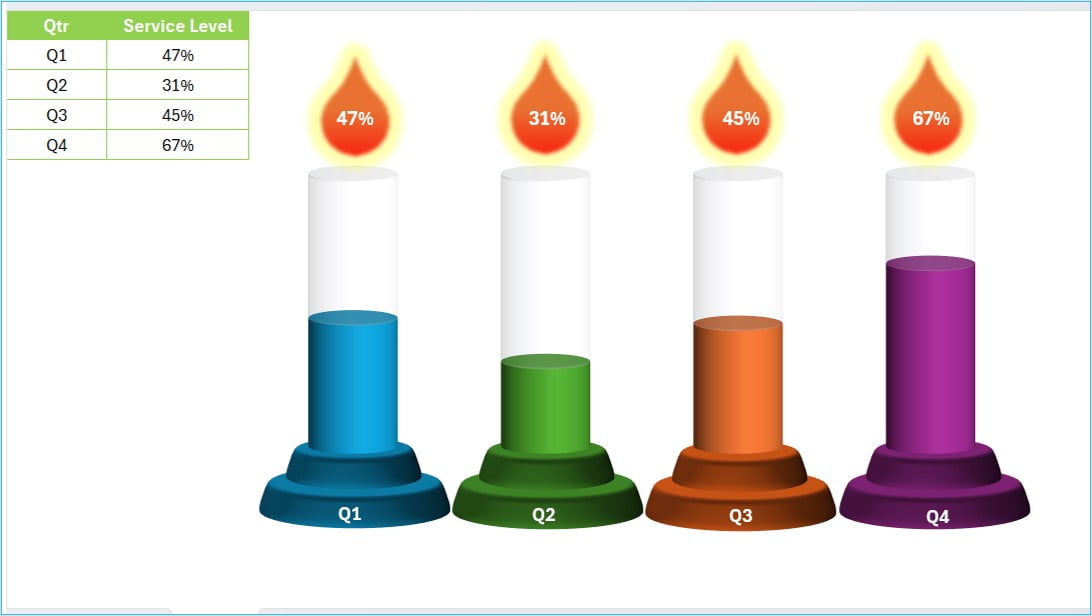
Power BI Power BI dashboard with 3D Glass Chart January 23, 2023January 23, 2023 PKComments Off on Power BI dashboard with 3D Glass Chart
Charts and Visualization Use of Symbols and Emojis in Excel Drop-down List and Excel Charts January 15, 2023January 15, 2023 PKComments Off on Use of Symbols and Emojis in Excel Drop-down List and Excel Charts
Charts and Visualization Quick Male-Female and Waffle Chart in Excel October 20, 2022October 20, 2022 PKComments Off on Quick Male-Female and Waffle Chart in Excel
Charts and Visualization Beer Mug Graph in excel March 3, 2022 PKComments Off on Beer Mug Graph in excel
Charts and Visualization Progress Bar Chart in Excel February 22, 2022 PKComments Off on Progress Bar Chart in Excel
Charts and Visualization Dynamic Circle Chart in Excel February 6, 2022February 6, 2022 PKComments Off on Dynamic Circle Chart in Excel
Charts and Visualization Pie of Pie Chart in Excel January 22, 2022 PKComments Off on Pie of Pie Chart in Excel
Charts and Visualization Stylish Column Chart in Excel November 7, 2021November 7, 2021 PKComments Off on Stylish Column Chart in Excel
Power BI Infographics in Power BI dashboard April 18, 2021May 3, 2021 PKComments Off on Infographics in Power BI dashboard
Dashboard Dynamic Dashboard with Tablet and Mobile shape in Excel May 17, 2020May 17, 2020 PKComments Off on Dynamic Dashboard with Tablet and Mobile shape in Excel