Microsoft Excel is widely used spreadsheet program data analysis and management. It allows you to perform complex calculations, create charts and graphs, and present data in a visually appealing way. One of the most useful features of Excel is the drop-down list using Data Validation. Using this feature, you can limit the choices available in a cell to a specific set of options. In this article, we will explain to you how to add symbols and emojis to the Excel drop-down list and charts. we will guide you; how can you make your data more engaging and visually appealing using symbols and emojis to the Excel drop-down list and charts.
What is a Excel drop-down list?
First, let’s take a moment to understand what a drop-down list is before we explore how to add symbols and emojis to it in Excel. A drop-down list is a handy data validation tool within Excel which allows you to select the choices available in a cell from a specific set of options. For instance, if you are creating a spreadsheet for employee data entry, you can create a drop-down list to categorize the departments into HR, IT, Sales, and Marketing. This approach not only guarantees consistency and accuracy in data entry but also makes it much simpler to filter and sort your data.
How to create a drop-down list in Excel?
Creating a drop-down list in Excel is a straightforward process. Here’s how to do it:
- Select the cell or cells where you want to create the drop-down list.
- Go to the “Data” tab and click on the “Data Validation” button.
- In the “Data Validation” dialog box, select “List” from the “Allow” dropdown menu.
- In the “Source” field, enter the options for your drop-down list separated by commas. For example, if you want to create a drop-down list for departments, you can enter “HR, IT, Sales, Marketing” in the “Source” field.
- Click “OK” to create the drop-down list.
Now that we have a basic understanding of drop-down lists let’s explore how to add symbols and emojis to the Excel drop-down list and charts.
Task Status drop-down using the symbol
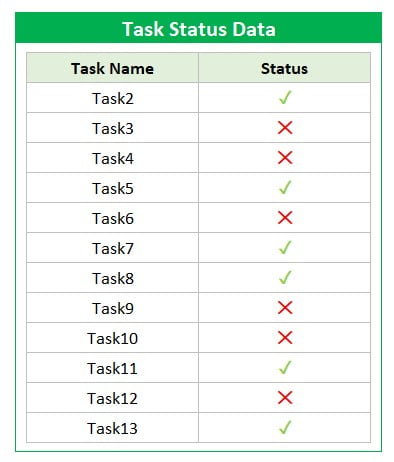
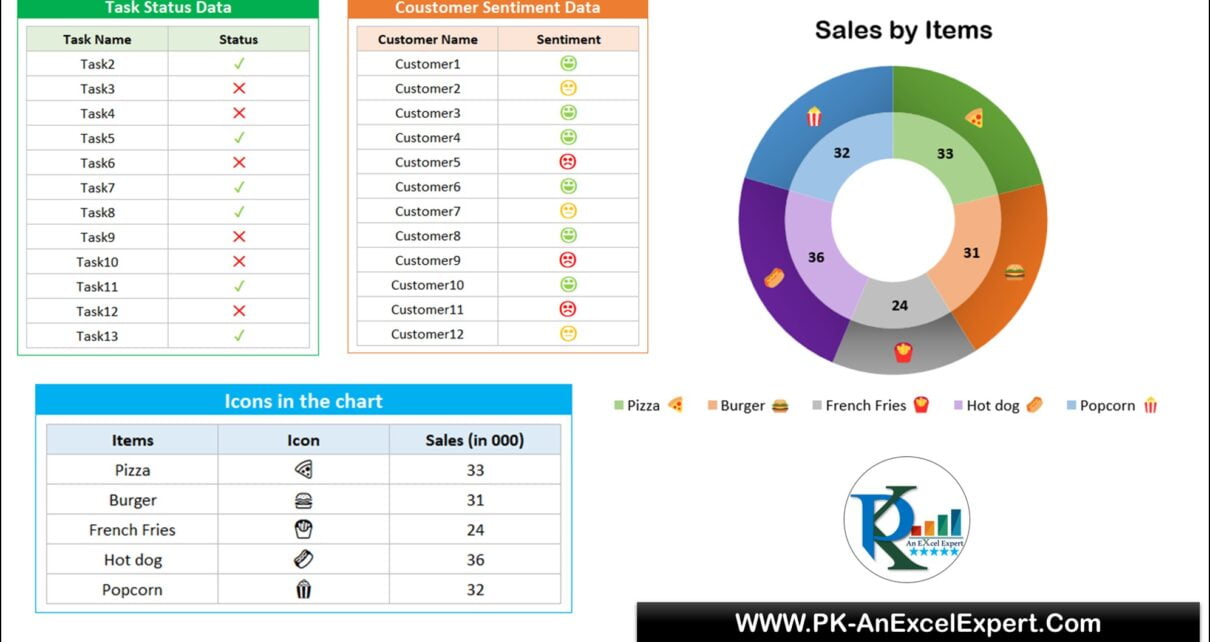
In this example, we will show you how to add symbols to the Excel drop-down list for task status. We will use the “✓” and “✕” symbols to represent completed and incomplete tasks, respectively.
Step 1: Create the drop-down list
- Select the cell or cells where you want to create the drop-down list.
- Go to the “Data” tab and click on the “Data Validation” button.
- In the “Data Validation” dialog box, select “List” from the “Allow” dropdown menu. In the “Source” field, enter “✓, ✕” (without the quotes) separated by a comma.
- Click “OK” to create the drop-down list.
Step 2: Conditional Formatting
To highlight the completed tasks with a green font and incomplete tasks with a red font, we will use conditional formatting.
- Select the cells wherein you have added the drop-down list.
- Go to the “Home” tab and click on “Conditional Formatting” in the “Styles” group.
- Select “New Rule” and then “Use a formula to determine which cells to format.”
- In the “Format values where this formula is true” field, enter the following formula for the “✓” symbol:
=$A1="✓"
- Here, A1 is the cell that contains the drop-down list, and “✓” is the symbol we want to highlight in green.
- Select the font color, background color, and other formatting options as per your preference.
- Click “OK” to apply the formatting.
Similarly, for the “✕” symbol, enter the following formula:
=$A1="✕"
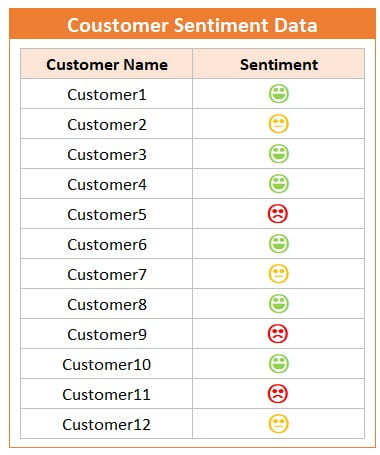
Customer Sentiment drop-down list using Emojis:
In this example, we have taken 😀, 😐 and ☹️ in the data Validation drop-down list. Then we have put the conditional formatting to highlight 😀 in green font color, 😐 in yellow font color, and ☹️ in red font color.
How to Add Symbols and Emojis to Excel Charts
Adding symbols and emojis to Excel charts is a wonderful way to make your data more visually appealing and interesting. To do this, you can use the Insert Symbol feature in Excel. Here’s how to add symbols and emojis to Excel charts:
- Select the cell where you want to insert the symbol or emoji.
- Press Windows+Period(.) shortcut key together in your keyboard.
- It will open the Symbol and Emoji popup.
- Select the symbol or emoji which you want to insert.
- Click on the symbol or emoji to insert it.
- The symbol or emoji will be inserted into the selected cell.
- To use the symbol or emoji in a chart, simply reference the cell that contains the symbol or emoji in the chart data.
Here’s an example of a doughnut chart with emojis for sales by items:
Doughnut chart with emojis for sales by items
This is a beautiful chart with Double Doughnut chart. In the inner circle, we have displayed the data labels and in the outer circle we have displayed the emoji of the Items. This type of chart can make your data more engaging and interesting.
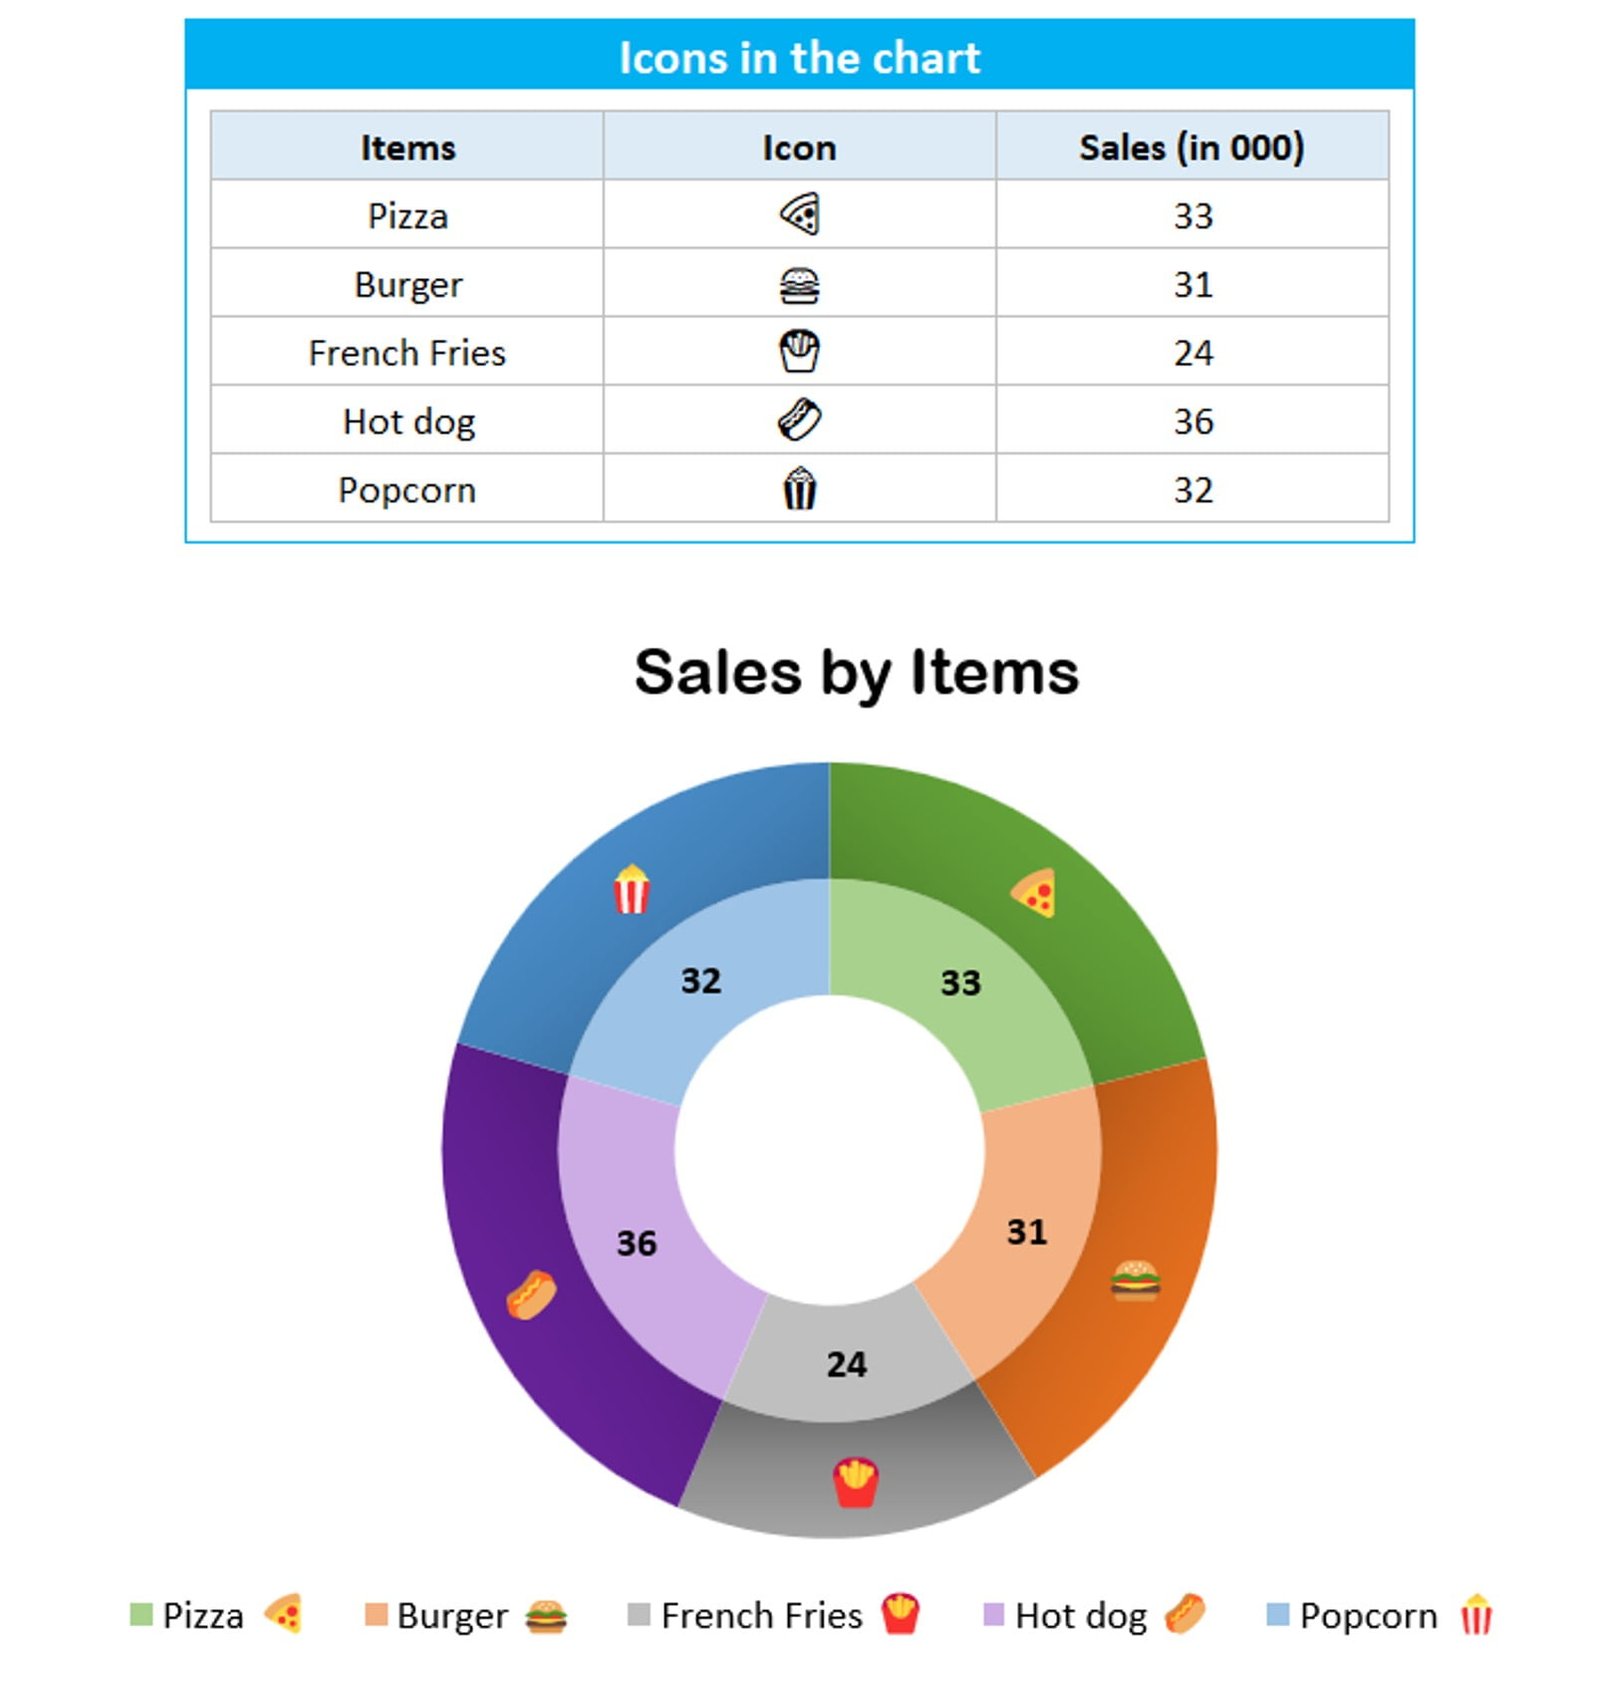
Icons on the Doughnut chart
Conclusion
Symbols and emojis can add a touch of creativity and clarity to your Excel drop-down lists and charts. You can use data validation, conditional formatting, and the Insert Symbol feature to easily incorporate these elements into your spreadsheets. Not only will this enhance your data presentation, but it will also make it more captivating for your audience.
So, if you’re searching for a way to make your Excel spreadsheets more visually appealing, adding symbols and emojis to your drop-down lists and charts is definitely worth considering. By using some straightforward techniques and unleashing your creativity, you can produce eye-catching and engaging spreadsheets. Ultimately, this will assist you in conveying your data more efficiently and effectively.
Visit our YouTube channel to learn step-by-step video tutorials
Watch the step-by-step video tutorial: