What-If Analysis in Excel is a group of tools that show how the result of a formula changes when you change its inputs, so you can compare options before committing to one. In this lesson you will learn what the What-If Analysis tools are, when to use Scenario Manager, Goal Seek and Data Table (and the Solver add-in), and how the chapters of this module fit together.
What is What-If Analysis?
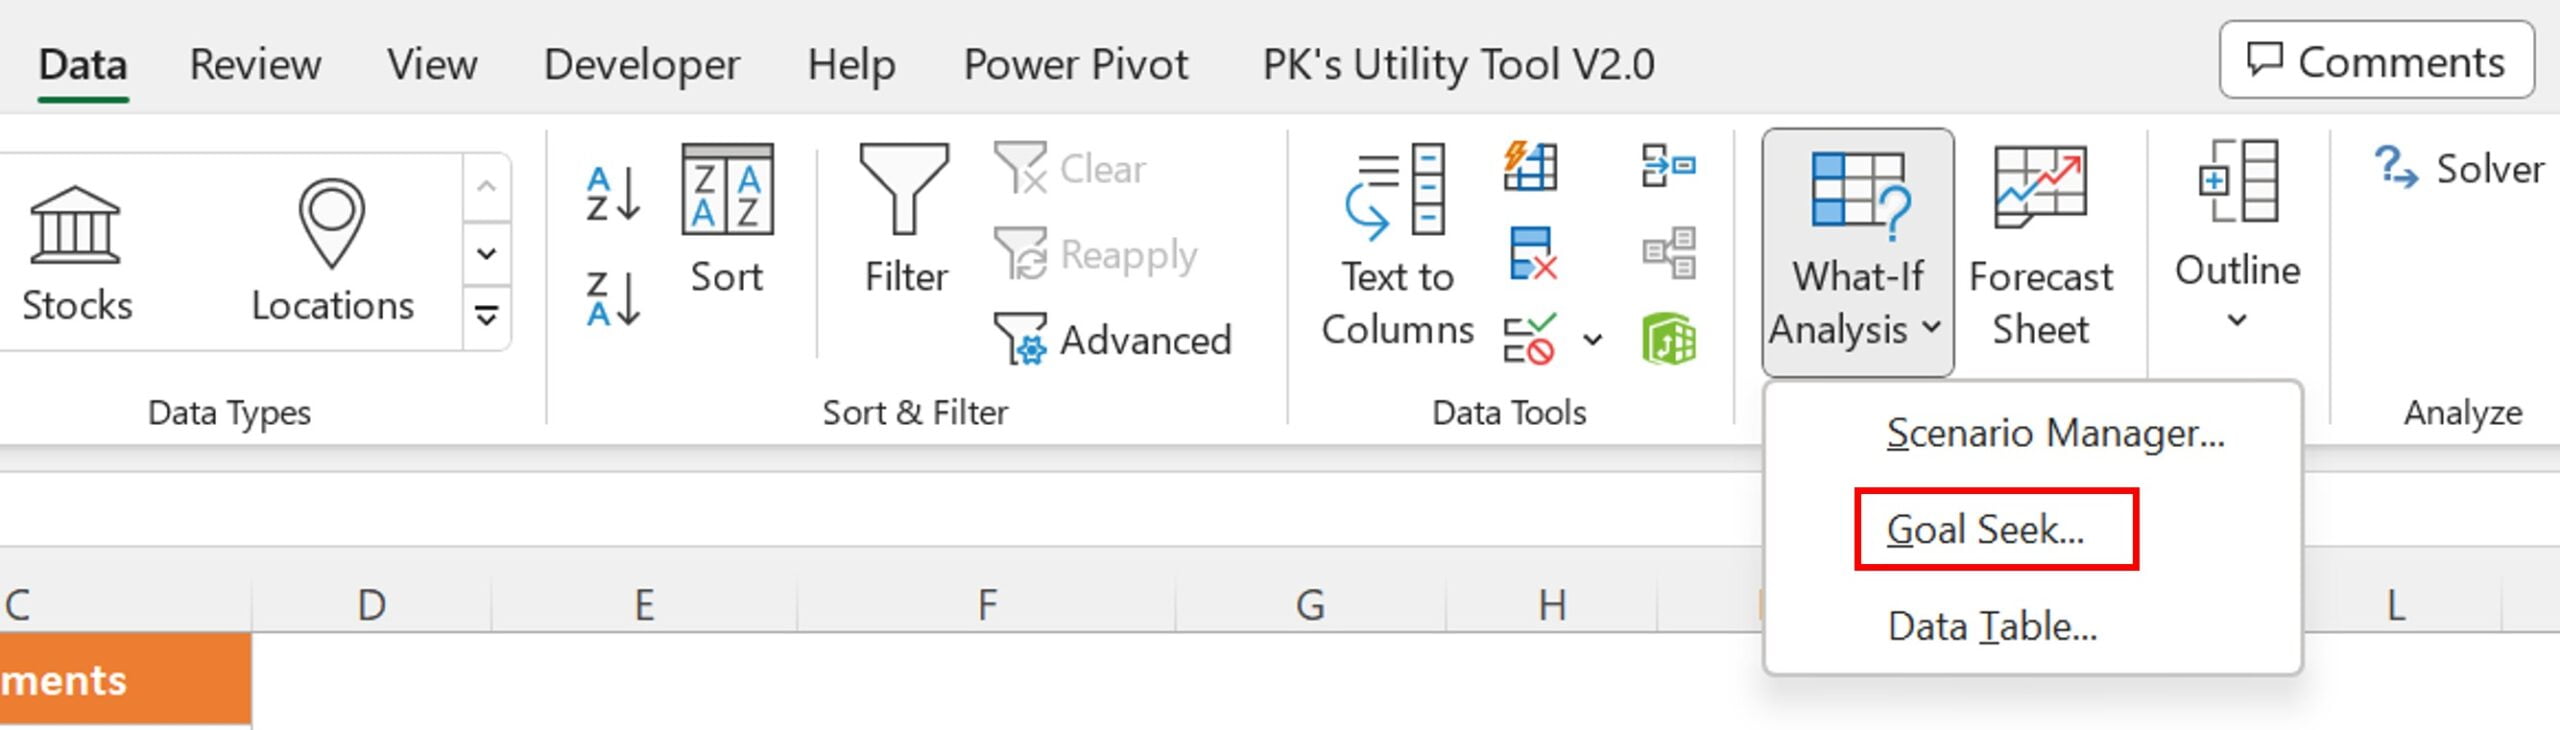
Every business model has inputs, such as price, quantity and cost, and outputs, such as revenue and profit, linked by formulas. What-If Analysis is the practice of changing the inputs deliberately to see the outputs move. Excel supports three directions of question. If I set these inputs, what is the result? (Scenario Manager). What input do I need to reach this result? (Goal Seek). How does the result change across a whole range of input values? (Data Table). A fourth question, which combination of inputs gives the best result within limits?, is answered by the Solver add-in. The tools live under Data > Forecast > What-If Analysis in Excel 2016 through Microsoft 365.
The four tools
Scenario Manager
Stores named sets of input values, for example Best Case, Base Case and Worst Case, each changing the same cells. You switch between them with one click and build a Scenario Summary report that lists every scenario side by side with the resulting outputs. Use it when a small number of inputs (up to 32) can take a handful of discrete alternatives and stakeholders want to compare them. Read the Scenario Manager chapter.
Goal Seek
Works backwards from a target. You tell Excel the formula cell, the value it should reach and the single input cell it may change, and it iterates until the target is met: the units needed to reach a profit, the interest rate that gives a required payment, the mark needed to pass. Use it whenever one input drives one output. Read the Goal Seek chapter.
Data Table
Builds a grid of results for every value of one input (one-variable table) or every combination of two inputs (two-variable table). It is the fastest way to see, for instance, monthly repayments for loan amounts down the side and interest rates across the top. Data tables recalculate live but can slow large workbooks; set Calculation to Automatic Except for Data Tables if needed.
Solver
An add-in enabled under File > Options > Add-ins. Solver changes many inputs at once to maximise, minimise or hit a target while respecting constraints such as budgets, capacities and whole-number requirements. Production planning, staff rostering and portfolio mixes are typical Solver problems.
How to set up a model for What-If Analysis
- Put every input in its own labelled cell and never type an input value inside a formula.
- Build the output formulas so that they reference those input cells directly or indirectly.
- Give the key input and output cells names (Formulas > Define Name) so scenario reports and Goal Seek dialogs show meaningful labels instead of B3 and B8.
- Choose the tool: Scenario Manager for discrete alternatives, Goal Seek for a single target, Data Table for a sweep, Solver for constrained optimisation.
- Save the workbook before running Goal Seek or Solver, because they overwrite the input cells.
Tips and common mistakes
- Hard-coded numbers break everything. A price typed inside a formula cannot be changed by any of these tools.
- Goal Seek changes one cell only. If several inputs must move, use Solver.
- Scenario values are stored, not linked. Editing a cell manually does not update the scenario; edit it in the Scenario Manager.
- Data Table formulas cannot be edited individually; they are an array. Delete the whole table to change it.
- Keep a Base Case scenario so you can restore the original inputs after experimenting.
Learn the What-If Analysis chapters
- Scenario Manager: create scenarios and a summary report
- Goal Seek: find the input value for a target result
- Data Table: one- and two-variable sensitivity tables
- Solver: optimisation with constraints
Return to the Advanced Excel course hub for the other modules.
Practice and real-world use
Build a five-row profit model (price, units, variable cost, fixed cost, profit), then create three scenarios, run Goal Seek for a target profit and finish with a two-variable Data Table of price against units. Budget planning, pricing decisions, loan comparisons and break-even analysis all rely on these tools.
Frequently asked questions
Where is What-If Analysis in Excel?
On the Data tab, in the Forecast group, click What-If Analysis to see Scenario Manager, Goal Seek and Data Table. Solver appears in the Analyze group once the add-in is enabled.
What is the difference between Goal Seek and Solver?
Goal Seek changes one input cell to make one formula reach one value. Solver changes many cells at once, can maximise or minimise instead of hitting a value, and respects constraints.
Can What-If Analysis work with formulas on other sheets?
Yes for Goal Seek and Solver as long as the chain of formulas links the input to the output. Scenario Manager changing cells and Data Table input cells must be on the same sheet as the tool is run from.
Want the finished version? Ready-made Excel dashboards, trackers and VBA systems are available at NextGenTemplates.com.